/
How to get Thread Dumps ~ Server & Data Center only
How to get Thread Dumps ~ Server & Data Center only
- Leslie Gilbert
- Ture Hoefner (Unlicensed)
Owned by Leslie Gilbert
Problem
Your pages are rendering slowly and you suspect that one of our apps/plugins is involved
Solution
Provide us a thread dump that we can use to analyze the processes running on the server during a performance problem. This requires you to use 2 different browsers or browser tabs: one to reproduce the problem and one to collect the thread dump using the support tools
- IN YOUR BROWSER FOR THE SUPPORT TOOLS, get ready to collect a thread dump
- Go to
 > General Configuration > Troubleshooting and support tools.
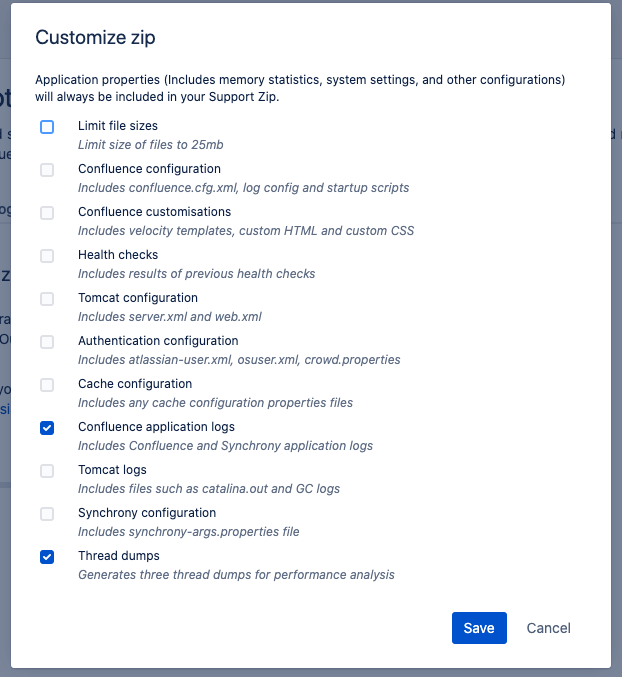
 - Choose Customize Zip
- Select: Confluence application logs, Thread dumps.
- Deselect the rest of the choices because we only need the thread dumps and the application logs and support zips can get huge.
- Click Save.
- IN YOUR BROWSER FOR REPRODUCING THE PROBLEM, initiate an action
- Click on the page or invoke the action that causes the performance problem
- IN YOUR BROWSER FOR THE SUPPORT TOOLS, immediately collect the thread dump
- Click Create Zip.
- Click Download zip.
- The zip will contain a *.tdump file that has 3 thread dumps taken 5 seconds apart
- Send the zip to us via google drive folder, we will provide you the link.
Related articles
, multiple selections available,
Related content
How do I provide useful data for performance issue analysis?
How do I provide useful data for performance issue analysis?
More like this
How do I provide useful data for performance issue analysis?
How do I provide useful data for performance issue analysis?
More like this
How do I provide useful data for performance issue analysis?
How do I provide useful data for performance issue analysis?
More like this
How do I provide useful data for performance issue analysis? (Sec&Enc)
How do I provide useful data for performance issue analysis? (Sec&Enc)
More like this
How do I provide useful data for performance issue analysis? (Google Drive)
How do I provide useful data for performance issue analysis? (Google Drive)
More like this
Downloading Confluence Server Log Files
Downloading Confluence Server Log Files
More like this