SP - survey reports
- Iryna Ihnatiuk
Survey reports help you track how your support team is performing, aggregate client responses and survey metrics, and analyze survey data.
Viewing reports
- Ensure that you can access survey reports for the project.
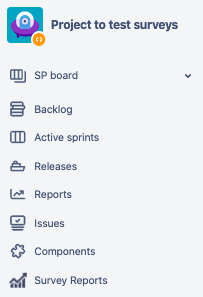
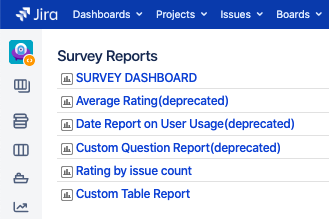
- Go to the project that you have enabled the surveys for and click Survey Reports.
- As a result, you will see a list of surveys set up for this project.
This is it! Enjoy your reports statistics and let us know if there is any other report that you might be interested in having.
You can always submit a feature request in our support portal.
Survey Dashboard
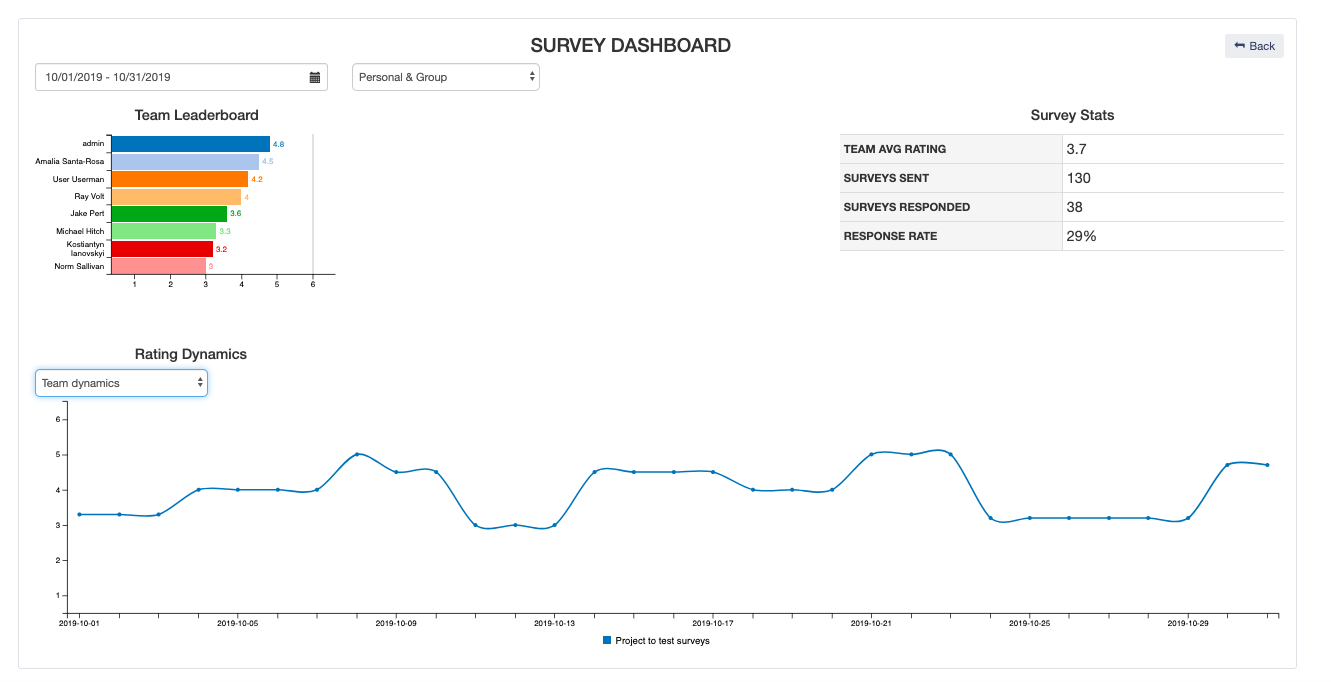
Survey Dashboard page brings you the most important metrics all in one page.
It helps you get answers to the following questions:
- How satisfied are clients with my support team?
- Is there any support agents who might need to work harder on their tickets based on the customer satisfaction?
- Have the average team/employee ratings changed over time? How? What are the rating trends?
- Are we sending enough surveys to understand customer satisfaction?
- How responsive are clients to our surveys?
- How is support agent A doing in terms of customer satisfaction?
- I know that my support agent B was not doing great in terms of resolving clients' tickets quickly and thus - has had bad survey reviews. Has this changed?
You can filter out a certain time frame for your dashboard, show and hide lines on the Rating Dynamics chart and display normalized average data if necessary.
Custom Table Report
This report enables you to view all survey related data that you are gathering and you will be able to select which columns (data) to display.
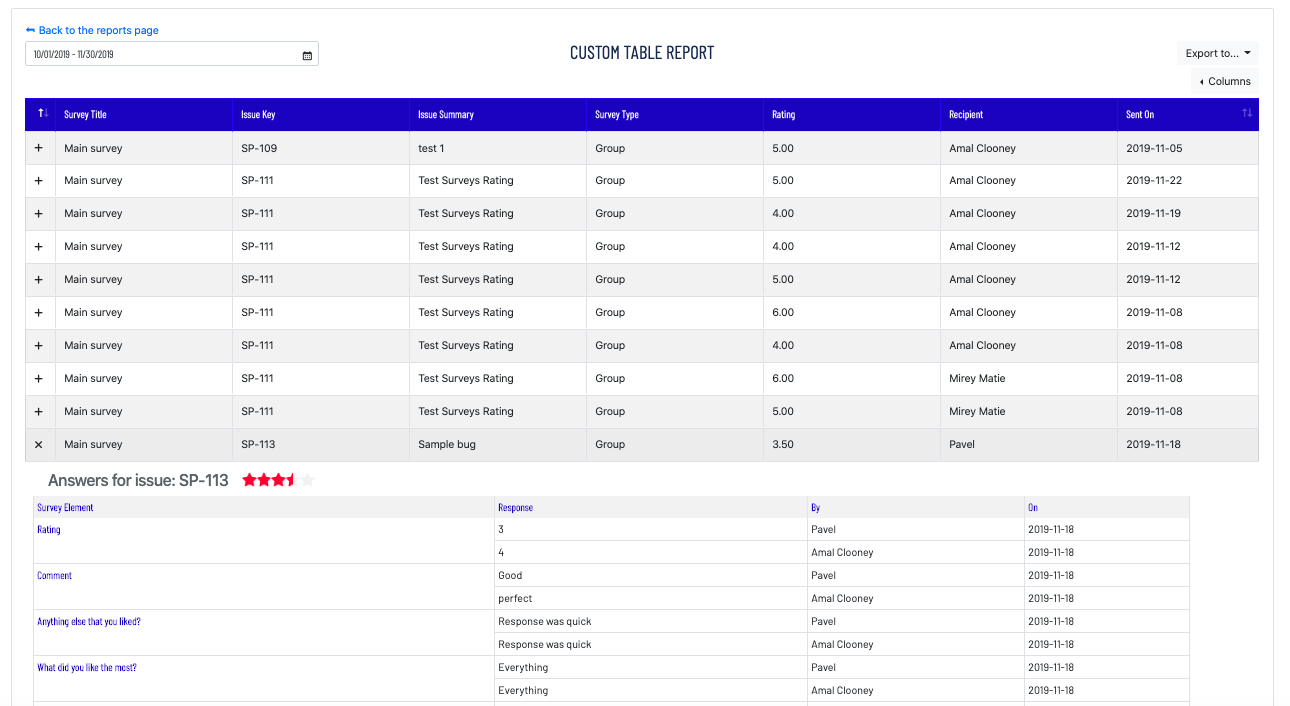
The Custom Table Report is useful for analyzing all aggregated survey data in one place, organized in a sortable, searchable table that you can further filter based on various criteria.
It gives you visibility into:
- Average rating for all tickets in the project
- Survey rating for every ticket where clients filled out a survey
- User survey comments on each resolved ticket
- Information about the ticket - issue key, summary, date when a survey was responded, assignee, ticket priority, etc.
- Which surveys were sent and when,
- Which surveys have been responded and which are still waiting on the response
- Which emails the surveys went to and IP addresses from which the responses were received
- Ticket information like issue key, summary, reporter and assignee
- Ticket information like a clickable issue key, summary
- User comments from the survey
- Custom question that you set up in the survey and the answers received from users
For quick navigation, the issue key is clickable so that you can quickly get to the ticket details.
Data in this report is sortable, and can be filtered by date, it is also searchable which is especially useful for long string values like user responses. You can also sort data in the columns, search inside each column or the entire report and filter by date.
You can export the report to XLSX, PDF, CSV etc. or copy data for further working with it.
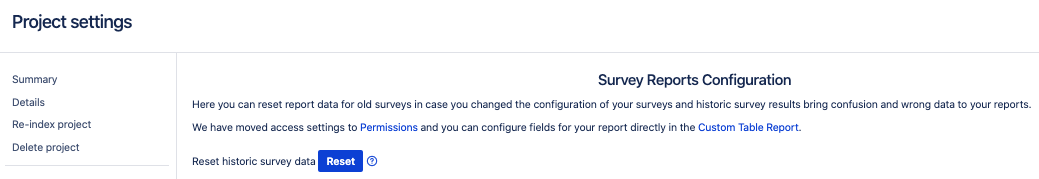
Resetting report data
Let's say you have a 5 rate survey in the project and then the requirements change and you want to switch to a 10 rating scale. You configure a new survey, launch it but have very confusing data in your reports. What used to be a great rating of 5 now is mediocre at best, and your survey reports are no longer helpful because you can't rely on mixed data calculations.
To avoid that we have implemented resetting the historic survey data. To do that, go to the project settings, select Reports in the SURVEYS FOR JIRA section, and click Reset historic survey data.
It clears all survey metrics for the sent / received surveys. This is useful when you want to stop tracking rating progress on your older surveys and start anew.
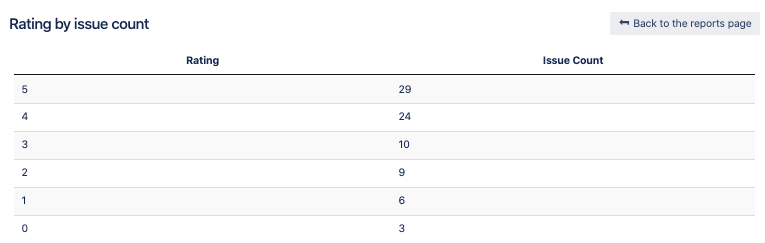
Rating by issue count
Use this report to get a quick view into which ratings your team is getting from the clients the most.