

 Graphviz Diagrams for Confluence
Support for Atlassian Server Products has ended in February 2024. Consider migrating to Graphviz Diagrams for Confluence’s Data Center version.
Or, are you planning to migrate to cloud? Make sure you do not lose your data/configurations in the process. Check out the Migration guide for information on how to migrate the app’s data to Cloud. Contact our support team if you have any questions.
Description
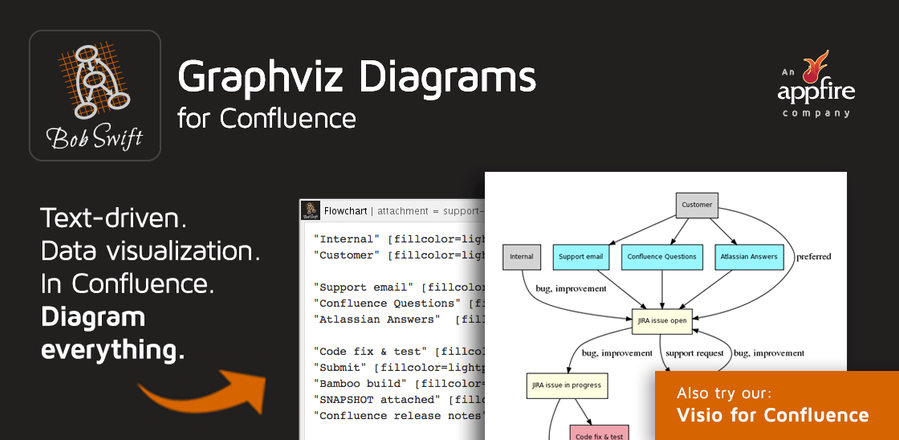
Graphviz Diagrams for Confluence helps generate and display graphs using DOT language for simple, plain text expressions. The app is available both on Confluence server and cloud. Visit Atlassian Marketplace to download the app.
Features
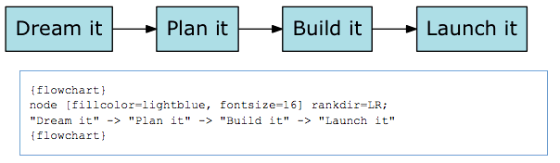
- Automatic diagram layout for plain text DOT language.
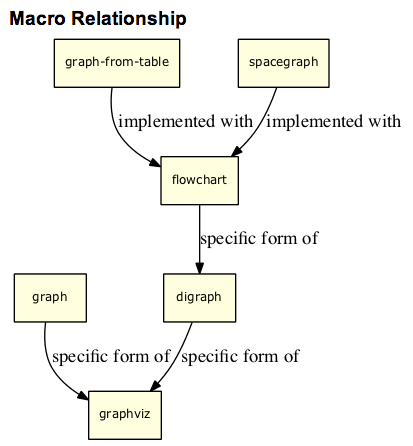
- Supports PlantUML to generate UML or non-UML graphs.
- Generate graphs from data in remote locations using profiles. Supports Bitbucket repositories and external applications like GitLab and GitHub.
- Output as PNG, SVG, JPG, or GIF.
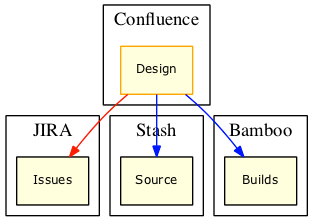
- Generate graphs of Confluence page hierarchy using the Space graph macro.
- Option to save the output as an attachment.
- Use wiki link syntax to create image links to Confluence or other content. See How to add links to Graphviz images.
- Plain text Graphviz markup makes it easy for automation to create graphs from other data.
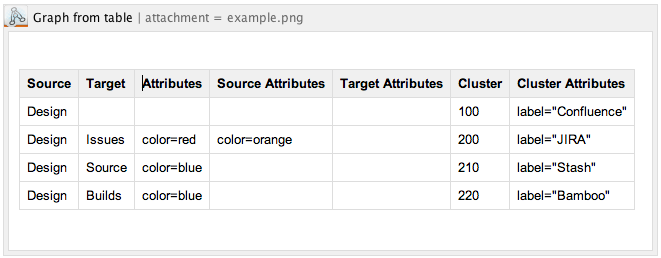
- (Server only) Diagrams from Confluence tables (native, SQL macro, CSV macro, Excel macro, Scripting for Confluence, and similar apps) using the Graph from table macro.
Requirements
Server only
Graph Visualization Software (Graphviz) installed on the Confluence server. See How to install Graphviz software.
More information
| Server | Cloud |
Gallery


Confluence®, Jira®, Atlassian Bamboo®, Bitbucket®, Fisheye®, and Atlassian Crucible® are registered trademarks of Atlassian®
Copyright © 2005 - 2024 Appfire | All rights reserved. Appfire™, the 'Apps for makers™' slogan and Bob Swift Atlassian Apps™ are all trademarks of Appfire Technologies, LLC.
Confluence®, Jira®, Atlassian Bamboo®, Bitbucket®, Fisheye®, and Atlassian Crucible® are registered trademarks of Atlassian®
Copyright © 2005 - 2024 Appfire | All rights reserved. Appfire™, the 'Apps for makers™' slogan and Bob Swift Atlassian Apps™ are all trademarks of Appfire Technologies, LLC.