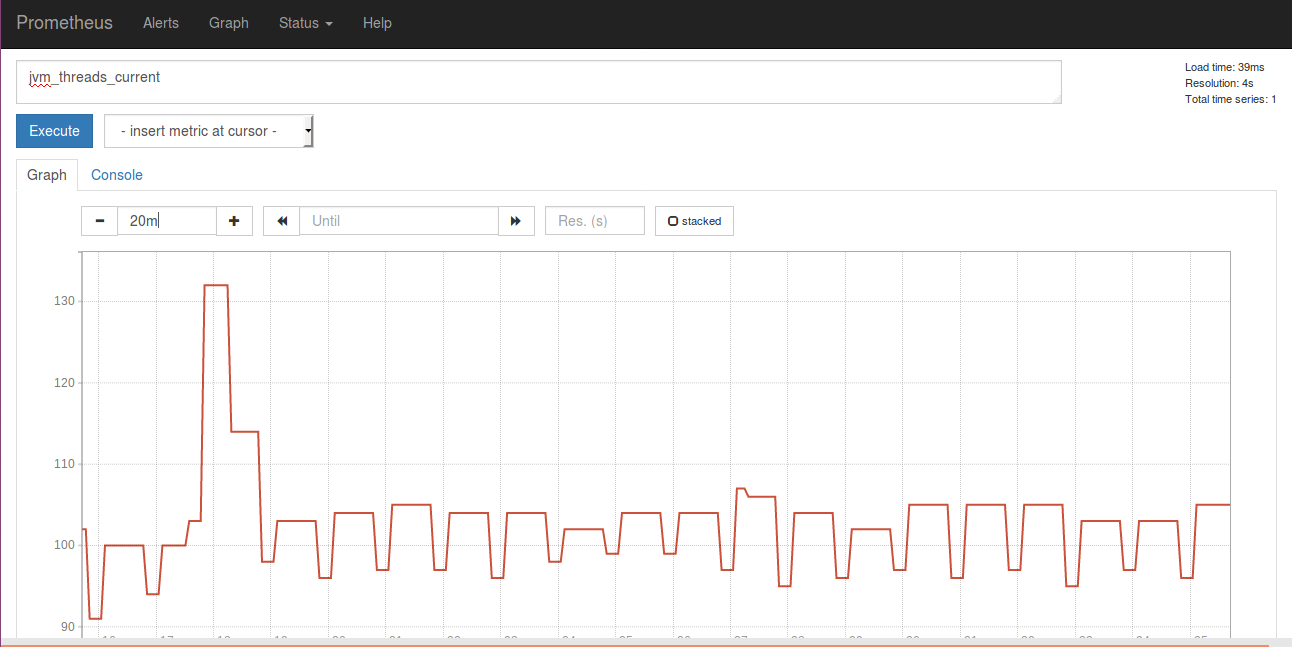
After you configure your Prometheus Exporter, you can expose the following metrics into Prometheus:
- JVM metrics
- Cluster metrics
- Label metrics
- Login / Logout statistics
- Space statistics
- JMX metrics
- Mail statistics
- Plugins statistics
- Other metrics
Metrics description
| Metrics | Type | Gathered By Job | Description |
|---|---|---|---|
JVM metrics | |||
| JVM metrics exposed with the Confluence exporter are the same as for Jira, see detailed description here. | |||
Cluster metrics | |||
| confluence_total_cluster_nodes_gauge | Gauge | No | Total cluster nodes gauge |
| confluence_cluster_panic_count | Counter | No | Cluster panic count |
Label metrics | |||
| confluence_label_create_count | Counter | No | Label create count |
| confluence_label_add_count | Counter | No | Label add count |
| confluence_label_remove_count | Counter | No | Label remove count |
| confluence_label_delete_count | Counter | No | Label delete count |
Login / Logout statistics | |||
| confluence_user_logout_count | Counter | No | Number of user logouts |
| confluence_user_login_count | Counter | No | Number of user logins. See example below. |
| confluence_user_failed_login_count | Counter | No | Number of failed logins |
Space statistics | |||
| confluence_space_create_count | Counter | No | Number of created spaces |
| confluence_space_delete_count | Counter | No | Number of deleted spaces |
JMX metrics | |||
| jvm_uptime_gauge | Gauge | No | JVM uptime gauge |
Mail statistics | |||
| confluence_mail_queue_gauge | Gauge | No | Current mail queue gauge |
| confluence_mail_queue_errors_gauge | Gauge | No | Current mail queue errors gauge |
| confluence_jmx_emails_attempted_count | Counter | No | The number of email messages Confluence has tried to send for each mail server added in Confluence. This metric has a label called mailservername. (only for Data Center from v.1.0.26) |
| confluence_jmx_emails_sent_count | Counter | No | The number of email messages sent successfully for each mail server added in Confluence. This metric has a label called mailservername. (only for Data Center from v.1.0.26) |
| confluence_jmx_mail_queue_error_queue_size | Gauge | No | Number of errors in the queue. (only for Data Center from v.1.0.26) |
| confluence_jmx_mail_queue_flushing | Gauge | No | Shows state (i.e. flushing, or not) (only for Data Center from v.1.0.26) |
| confluence_jmx_mail_queue_retry_count | Gauge | No | The number of retries that were performed. (only for Data Center from v.1.0.26) |
| confluence_jmx_mail_queue_task_size | Gauge | No | Number of email messages queued for dispatch. (only for Data Center from v.1.0.26) |
Plugins statistics | |||
| confluence_plugin_enabled_count | Counter | No | Number of enabled apps |
| confluence_plugin_disabled_count | Counter | No | Number of disabled apps |
| confluence_plugin_install_count | Counter | No | Number of installed apps |
| confluence_plugin_uninstall_count | Counter | No | Number of uninstalled apps |
Other metrics | |||
| confluence_maintenance_expiry_days_gauge | Gauge | No | Maintenance Expiry Days Gauge |
| confluence_license_expiry_days_gauge | Gauge | No | License Expiry Days Gauge (since version 1.0.21) |
| confluence_active_users_gauge | Gauge | Yes | Active Users Gauge |
| confluence_one_hour_active_users_gauge | Gauge | Yes | Users Login One Hour Ago Gauge |
| confluence_today_active_users_gauge | Gauge | Yes | Users Login Today Gauge |
| confluence_allowed_users_gauge | Gauge | No | Allowed Users Gauge |
| confluence_total_attachment_size_gauge | Gauge | Yes | Total Attachments Size Gauge |
| confluence_request_duration_on_path | Histogram | No | Request duration on path |
| confluence_current_contents_gauge | Gauge | Yes | Current Contents Gauge |
| confluence_global_spaces_gauge | Gauge | Yes | Global Spaces Gauge |
| confluence_personal_spaces_gauge | Gauge | Yes | Personal Spaces Gauge |
| confluence_pages_gauge | Gauge | Yes | Total Pages Gauge |
| confluence_blogposts_gauge | Gauge | Yes | Total BlogPosts Gauge |


