PE - Using Prometheus Exporter for Confluence
- Iryna Ihnatiuk
- Elena Kolesnik
Go to Administration → Manage apps → Prometheus Exporter → Metrics and select which metrics must be collected and how (in real-time or by a scheduled job), see the last execution date and how long metrics were executed.

Once you configure your Prometheus Exporter, you can expose the following metrics into Prometheus.
Metrics description
| Metrics | Type | Description |
|---|---|---|
Request Duration Prometheus Metrics Module | ||
| confluence_request_duration_on_path | Histogram | Shows how long requests were executed on the server. It does not take into consideration the browser execution and network execution time. Read more here. |
Confluence JMX Metrics Module | ||
confluence_jmx_indexstat_flushing | Gauge | Indicates whether the cache is currently flushing |
confluence_jmx_indexstat_last_duration | Counter | Time taken during last indexing (ms) |
confluence_jmx_indexstat_task_queue | Counter | Shows number of tasks in the queue |
confluence_jmx_indexstat_reindexing | Gauge | Indicates whether Confluence is currently reindexing |
confluence_jmx_systemstat_db_latency | Counter | Shows the latency of an example query performed against the database |
confluence_jmx_request_avg_exectime_of_ten_requests | Counter | Shows the latency of an example query performed against the database |
confluence_jmx_request_current_served_number | Counter | Number of requests being served at this instant |
confluence_jmx_request_errorpage_count | Counter | Number of times the Confluence error page was served |
confluence_jmx_request_num_in_last_ten_seconds | Counter | The number of requests in the last ten seconds |
confluence_jmx_emails_attempted_count | Counter | The number of email messages Confluence has tried to send. for each mail server added in Confluence. This metric has a label called mailservername (only for Data Center from v.1.0.26) |
confluence_jmx_emails_sent_count | Counter | The number of email messages sent successfully for each mail server added in Confluence. This metric has a label called mailservername (only for Data Center from v.1.0.26) |
confluence_jmx_mail_queue_error_queue_size | Gauge | Number of errors in the queue (only for Data Center from v.1.0.26) |
confluence_jmx_mail_queue_flushing | Gauge | Shows state (i.e. flushing, or not) (only for Data Center from v.1.0.26) |
confluence_jmx_mail_queue_retry_count | Gauge | The number of retries that were performed (only for Data Center from v.1.0.26) |
confluence_jmx_mail_queue_tasks_size | Gauge | Number of email messages queued for dispatch (only for Data Center from v.1.0.26) |
jvm_uptime_gauge | Gauge | JVM Uptime Gauge |
Confluence System Metrics Module | ||
confluence_maintenance_expiry_days_gauge | Gauge | Maintenance Expiry Days Gauge |
confluence_license_expiry_days_gauge | Gauge | License Expiry Days Gauge (since version 1.0.21) |
confluence_total_cluster_nodes_gauge | Gauge | Total Cluster Nodes Gauge |
confluence_cluster_panic_count | Counter | Cluster Panic Count |
confluence_plugin_enabled_count | Counter | Plugin Enabled Count |
confluence_plugin_disabled_count | Counter | Plugin Disabled Count |
confluence_plugin_install_count | Counter | Plugin Install Count |
confluence_plugin_uninstall_count | Counter | Plugin Uninstall Count |
Confluence User Metrics Module | ||
confluence_active_users_gauge | Gauge | Active Users Gauge |
confluence_one_hour_active_users_gauge | Gauge | The total number of logins within the last hour |
confluence_today_active_users_gauge | Gauge | Users Login Today Gauge |
confluence_allowed_users_gauge | Gauge | Allowed Users Gauge |
confluence_user_logout_count | Counter | User Logout Count |
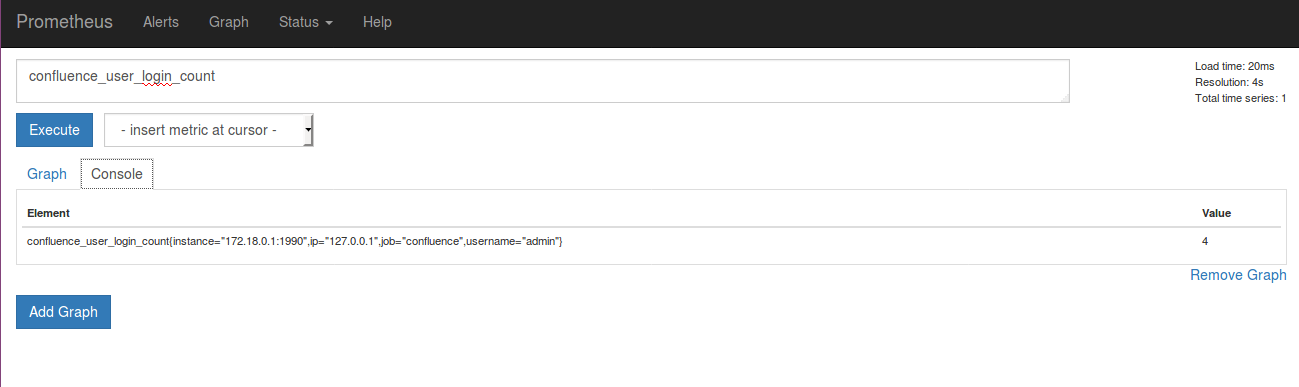
confluence_user_login_count | Counter | User Login Count. See example below. |
confluence_user_failed_login_count | Counter | User Failed Login Count |
Confluence Entity Metrics Module | ||
confluence_total_attachment_size_gauge | Gauge | Total Attachments Size Gauge |
confluence_current_contents_gauge | Gauge | Current Contents Gauge |
confluence_global_spaces_gauge | Gauge | Global Spaces Gauge |
confluence_personal_spaces_gauge | Gauge | Personal Spaces Gauge |
confluence_pages_gauge | Gauge | Total Pages Gauge |
confluence_blogposts_gauge | Gauge | Total BlogPosts Gauge |
confluence_label_create_count | Counter | Label Create Count |
confluence_label_add_count | Counter | Label Add Count |
confluence_label_remove_count | Counter | Label Remove Count |
confluence_label_delete_count | Counter | Label Delete Count |
confluence_space_create_count | Counter | Space Create Count |
confluence_space_delete_count | Counter | Space Delete Count |
Confluence Mail Metrics Module | ||
| confluence_mail_queue_gauge | Gauge | Current Mail Queue Gauge |
| confluence_mail_queue_errors_gauge | Gauge | Current Mail Queue Errors Gauge |
On top of predefined metrics within Prometheus Exporter PRO for Confluence there is an option to add custom metrics by creating your own app. For more details refer to the following detailed guide. Creating app for Confluence is similar to creating app for Jira.
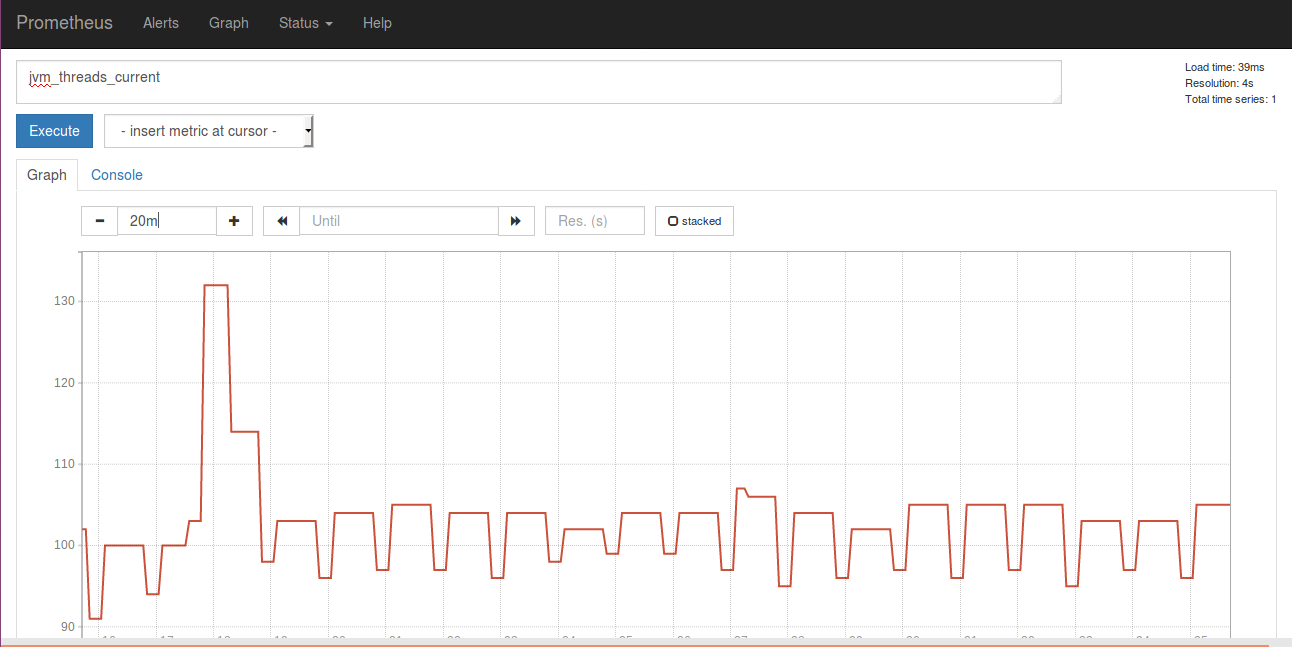
JVM metrics examples

Login / logout statistics example