CvC - Using Committed vs Completed report
Contents
Prerequisites
Ensure that you are good on the following prerequisites:
- The time tracking is enabled or the Story Points field is available
- Committed vs Completed report is added to your dashboard
- You have configured the Committed vs Completed Gadget
Reading the chart
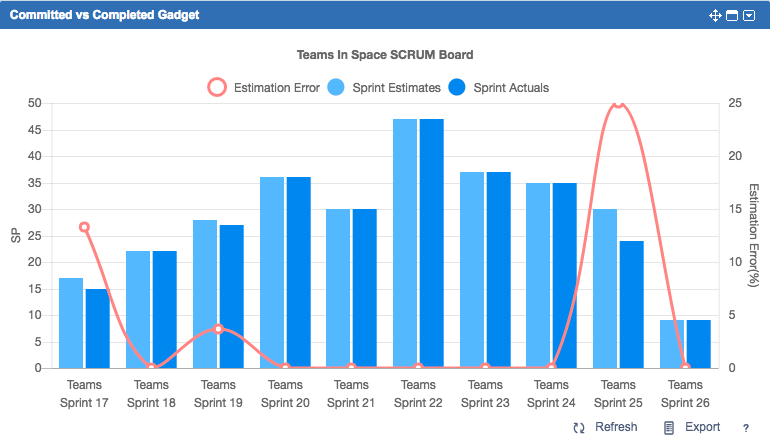
Your Committed vs Completed Gadget displays the following information:
- Commitment for each sprint measured in man-days or story points
- Actual work delivered measured in the same metrics
- Estimation Error – a red line indicating the estimation error as a percentage for each sprint. This line helps you identify the accuracy of how your team is providing estimations. If the estimation error decreases, it means that the team is getting better and more precise in measuring the assigned tasks, thus you are on the right track.
Reading the chart
The following example shows that the team had certain spike in sprint 17, then the team had a positive trend where the estimation accuracy increased. After that, there was some distraction or a spike in sprint 25 causing the team to accomplish very few story points and focus on something else. After sprint 25 though, it looks like the lessons were learnt, and the team's estimates (commitments) for the last sprint are going inline with commitment which is fantastic accuracy and shows that the team matured and is showing great results in estimate (commitments) accuracy.
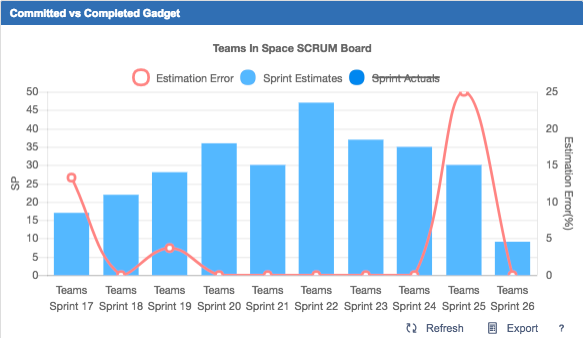
Selecting data to display on the chart
The interface enables you to customize your report view by showing and hiding the data depending on your current focus. For instance, if you are focused on sprint estimates (commitments) and the estimation error, you can hide the sprint actuals by clicking the name in the chart legend as shown below. To display hidden data again, click its name in the legend again.
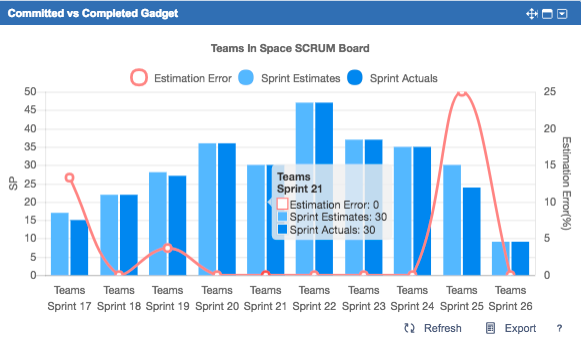
Tooltips
For you to have an instant insight into what the certain parts of the chart mean and how much work was delivered at a certain point in time, hover over a place on the chart. The tooltip will show details for the selected point on the report.
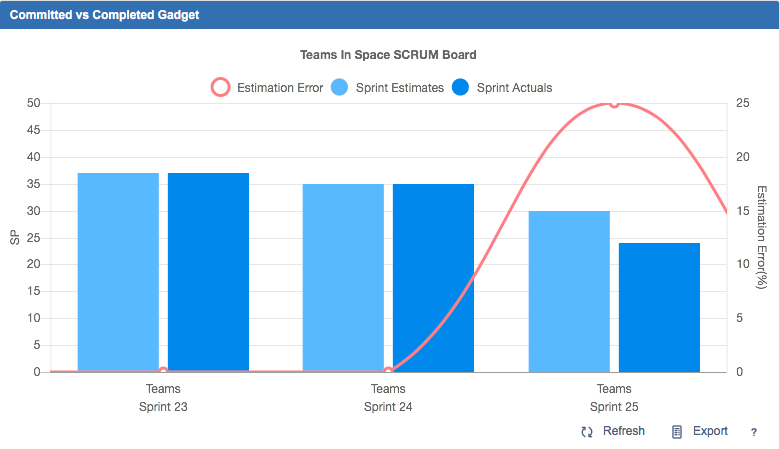
Zoom feature
If you have too many sprints displayed on the report, it might get difficult to read data (see screenshot), so you can zoom in to see only a few sprints of interest. To zoom in, hover over the chart area and use the mouse wheel or your track pad. Also, you can pan over the chart by clicking and dragging on a section of the chart. To zoom out, you can use your mouse wheel or click the Refresh button.
Commited vs Completed details in tabs
Working with the report details, you might want to have more insights in addition to chart view. For this purpose we provide detailed information, insights, and warnings in a table view below the chart.
There are the following tabs with the report insights:
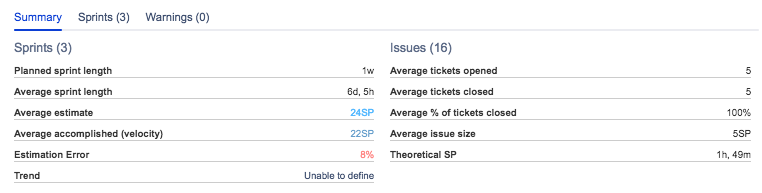
Summary tab
Here you can view information about planned and delivered work measured in the selected metrics, average length for the sprint and average velocity, and warnings in case the actual progress is behind the plan. Note: In case source data is not available the panel is hidden.
| Stats | Description |
|---|---|
| Planned sprint length | Sprint length as planned in Jira (start and end dates specified when starting the sprint), measured in weeks. |
| Average sprint length | The actual average duration of a sprint based on when the sprint was actually started and completed. This can be different from what you define as the start / end date for your sprints |
| Average estimate | The average of work committed to be delivered for each sprint in the report. |
| Average accomplished (velocity) | The average of actual work delivered in each sprint, this is your team's velocity. |
| Estimation Error | Percentage of the estimation error for each sprint. Tip: Ensure that you have at least 2 completed sprints to view the Estimation Error line, otherwise it won't be displayed. The estimation error is showing the estimation inaccuracy percentage increase or decrease. For example: Estimation error = (30 - 24) / 24 * 100 = 25% |
| Trend | Estimation accuracy trend:
|
| Average tickets opened | The average number of tickets opened in a sprint. |
| Average tickets closed | The average number of tickets closed in a sprint. |
| Average % of tickets closed | The average percentage of tickets closed in a sprint. |
| Average issue size | The average size of an issue, measured in story points or time depending on which metrics is used. This number is based on the sprints that are selected for the report. |
| Theoretical SP (story point) | Amount of time that one story point equals to for this team, measured in hours. This theoretical value is based on the estimates that the team gives and time it takes to perform work. |
This statistics can help you plan the future sprints. For example you can use average estimated or average accomplished as the value for the ideal team velocity and plan sprints taking this into account.
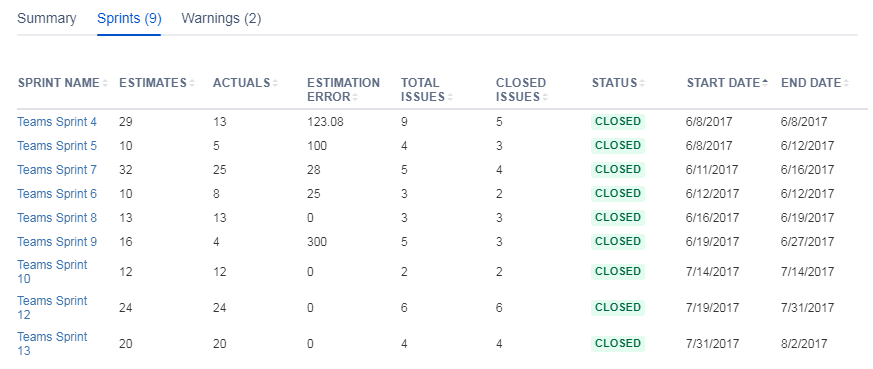
Sprints tab
The Sprints tab contains details on the sprints that are included in the report. The sprints are clickable to make the navigation faster for you.
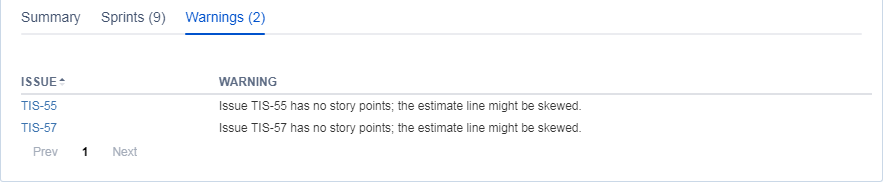
Warnings tab
Warnings are generated to help you identify cases when chart's data might show not the actual picture. For instance, when an issue is not estimated or when a ticket is resolved outside of the sprint and is not marked as a duplicate or clone. The tickets in the Warnings tab are not in included into the chart calculations, so to ensure the chart's accuracy, click the issue in the warning and take action, for instance – fill out the necessary fields in this ticket.
Exporting report data
You can save the chart image, all you have to do is right click the chart area and select Save image. You can also export the statistics and the sprints details into the XLS file by clicking the Export button.
Other tips and tricks
For you to have a meaningful data on the Committed vs Completed Gadget, check on the following items:
- You have at least 1 completed sprints to filter by the SCRUM board
- You check the Warnings tab from time to time and triage tickets from there. The tickets shown in the Warnings tab are not included into the chart calculations, and thus in order to see the accurate picture on the chart, you might want to triage those tickets first.