AR - What's new in Agile Reports for Jira 3.1
Contents
The old documentation (for version 2.0) can be downloaded from here.
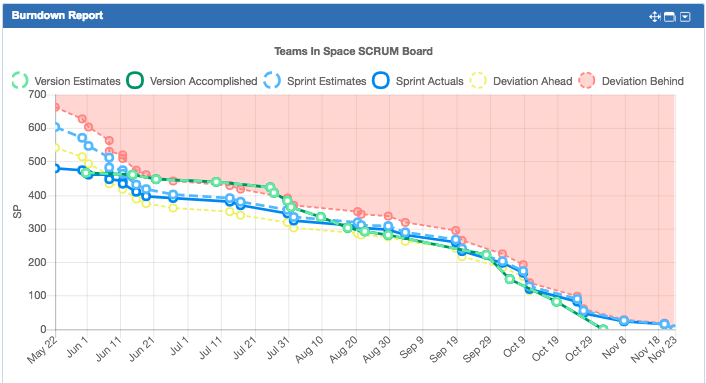
Burnup or Burndown - you still get the insights you want
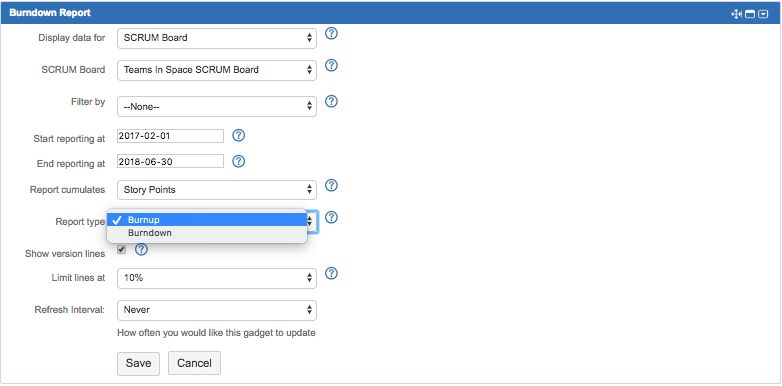
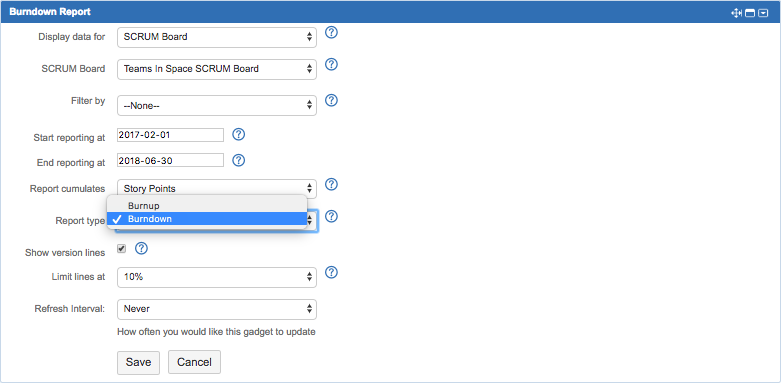
Some people prefer to see how much work they have accomplished (burnup), others – how much work remains to be done (burndown). You asked and we listened! With version 3.1 of the Agile Reports we have added the flexibility for you to define whether to view team progress as a burnup or burndown report.
| Burnup report | Burndown report |
|---|---|
|
|
|
|
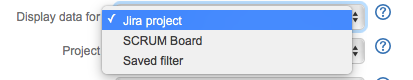
You decide which data to pick for the report
Setting up your reports has become convenient and flexible. In addition to building a report based on a SCRUM board, Agile Reports for Jira 3.1 now enable you to build the reports for a Jira project and a saved filter. This is exceptionally helpful for companies that adopted SAFe as with the saved filter you can define what Program level reporting means to you and can build a flexible report for several Jira projects, SCRUM boards, teams or in any way you want – JQL and Agile Reports is all you need.
The saved filter is also helpful in the companies where standard Agile reporting wouldn't work for their specific Jira configuration. A standard report would either provide incorrect data or the team would have to tweak their Jira workflow in a way that would adapt to the reporting - no fun. With the saved filter you define which work to track, which tickets to include in the report, and which data to analyze.
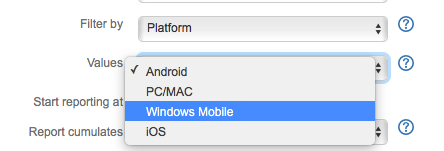
More flexibility with additional filtering
Starting with version 3.1 of Agile Reports, you can filter the Burnup (BU) and Committed vs Completed (CvC) gadgets data by Sprint, Version, and additionally - any global custom field of the single select type. For example, you group your deliverables using a Platform custom field (Android or iOS for instance). You can build a report for your entire team and use the additional filtering to see just the Android sub-team performance, no need to readjust the gadget, tweak your SCRUM board settings, or change the saved filter.
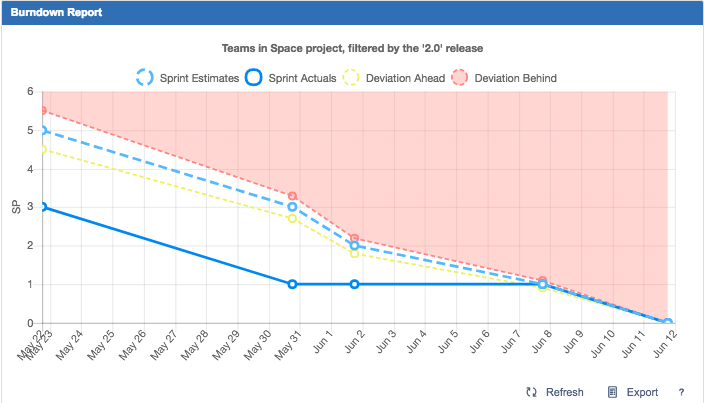
Dynamic chart headers
When you use additional filters for the report data (for example, version, sprint, or a custom field, like Product or Target Quarter), a refined report reflects this in the header to help you quickly get the context.
For example, the following chart header implies that the Burndown report is built for the Teams in Space Jira project, and this report is additionally filtered to display the version 2.0 only.
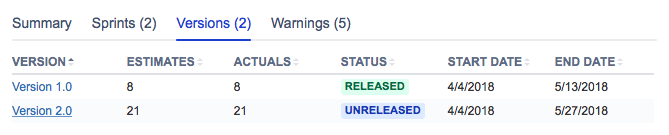
Drill down to version data
The versions in the Versions tab are now clickable, and you can drill down to details of the specific version just by clicking this version in the Versions tab.