...
| Table of Contents | ||||
|---|---|---|---|---|
|
| Anchor | ||||
|---|---|---|---|---|
|
Dynamic filtering on Jira Service Management specific fields – Customer Request Type and Organizations
Users can define dynamic filters that work exactly like the other dynamic filters provided by the Rich Filters for Jira Dashboards app. This allows users to easily focus on particular request types or organizations.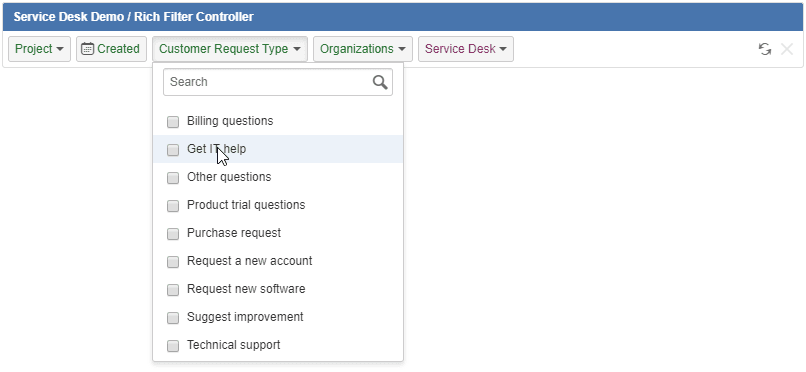
Statistics on Jira Service Management specific fields – Customer Request Type and Organizations
Users can easily visualize metrics and performances per request type or organization.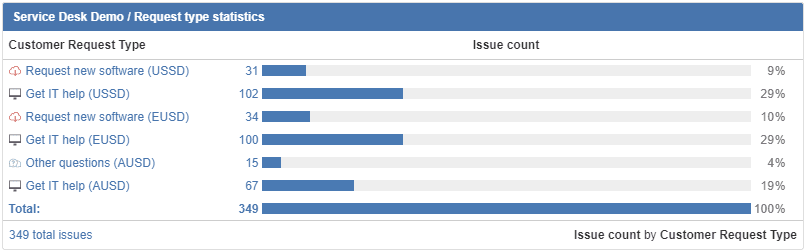
| Anchor | ||||
|---|---|---|---|---|
|
The following rich filter gadgets provide new functionality specific to Service Management as described below:
The Rich Filter Statistic Gadget – displays SLA Completed, Met, Breached, %Met, %Breached, and Average values.
Users can monitor values for one or multiple SLA fields
The Rich Filter Two Dimensional Statistics Gadget – display SLA Completed, Met, Breached, %Met, %Breached, Average values
Users can see in detail SLA values displayed for issues grouped on two axes
The Rich Filter Simple Counter Gadget – displays SLA Completed, Met, Breached, and Average values
Users can monitor values for one or multiple SLA fields
The Rich Filter Simple Gauge Gadget – displays SLA %Met and %Breached values
Users can monitor SLA Met and Breached ratios for one or multiple SLA fields
The Rich Filter Smart Counters Gadget – display SLA Completed, Met, Breached, Average values
Users can monitor SLA values split by user-defined criteria (for example, by Service Desk)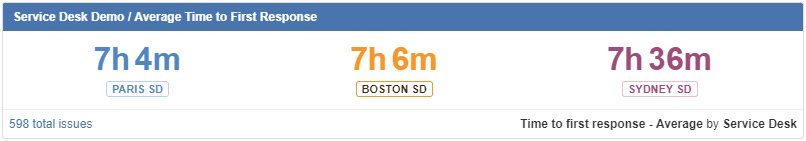
The Rich Filter Smart Gauges Gadget – displays SLA %Met and %Breached values.
Users can monitor SLA Met and Breached ratios split by user-defined criteria (for example, by Service Desk)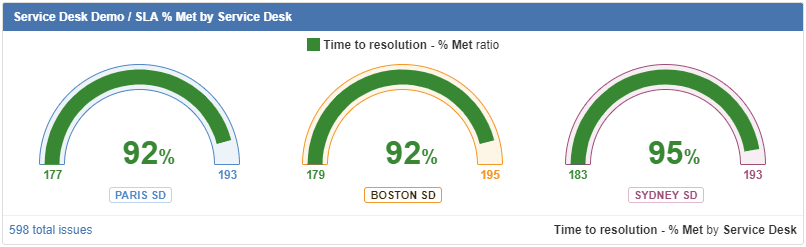
| Anchor | ||||
|---|---|---|---|---|
|
The following rich filter gadgets provide new functionality specific to Service Management as described below:
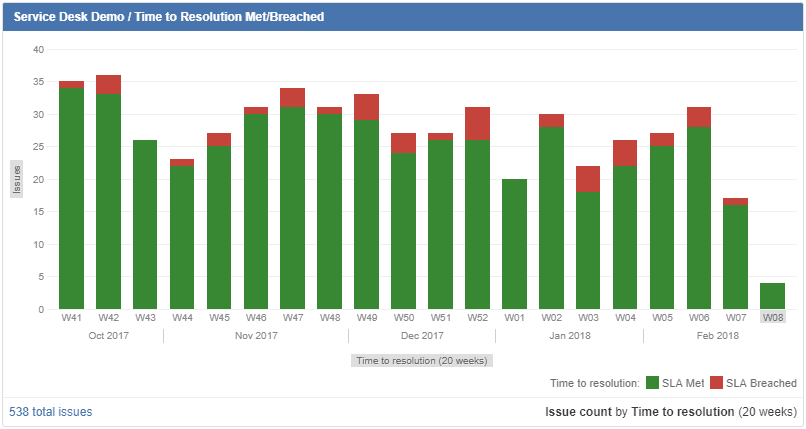
The Rich Filter Date Bar Chart Gadget – displays any SLA Met/Breached ratio based on the SLA completion date
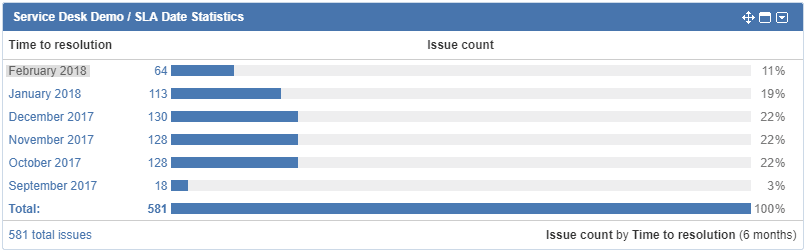
The Rich Filter Statistic Gadget – displays SLA values based on the completion date of any SLA
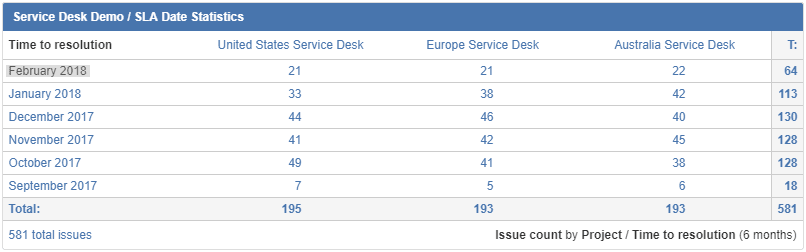
The Rich Filter Two Dimensional Statistics Gadget – displays SLA values based on the completion date of any SLA
| Anchor | ||||
|---|---|---|---|---|
|
...
Time series based on service management SLA values
The following rich filter gadgets provide new functionality specific to Service Management as described below:
The Rich Filter Time Series Chart Gadget – displays SLA time series as line charts to see trends based on SLA values: Completed, Met, Breached, %Met, %Breached, or Average
Users can easily spot trends and correlations to understand the performances of their Service Management projects.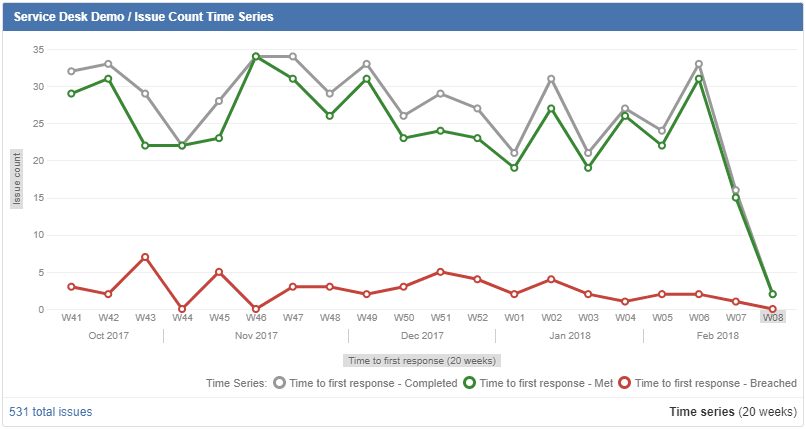
The Rich Filter Statistics Gadget – displays SLA time series as tables to see trends based on SLA values: Completed, Met, Breached, %Met, %Breached, or Average
Users can easily spot trends and correlations to understand the performances of their Service Management projects.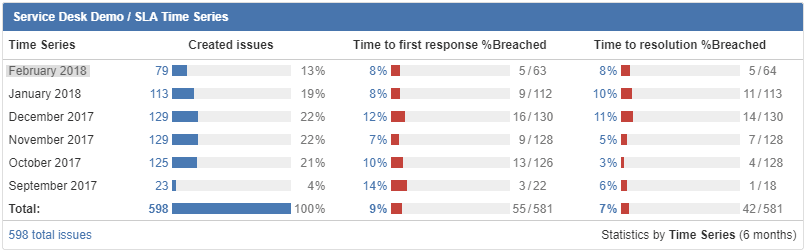
| Anchor | ||||
|---|---|---|---|---|
|
The Satisfaction field can be used as a numeric field numerically in rich filters and rich filter gadgets. More precisely, users can:
...