...
...
...
Inline editing of task duration
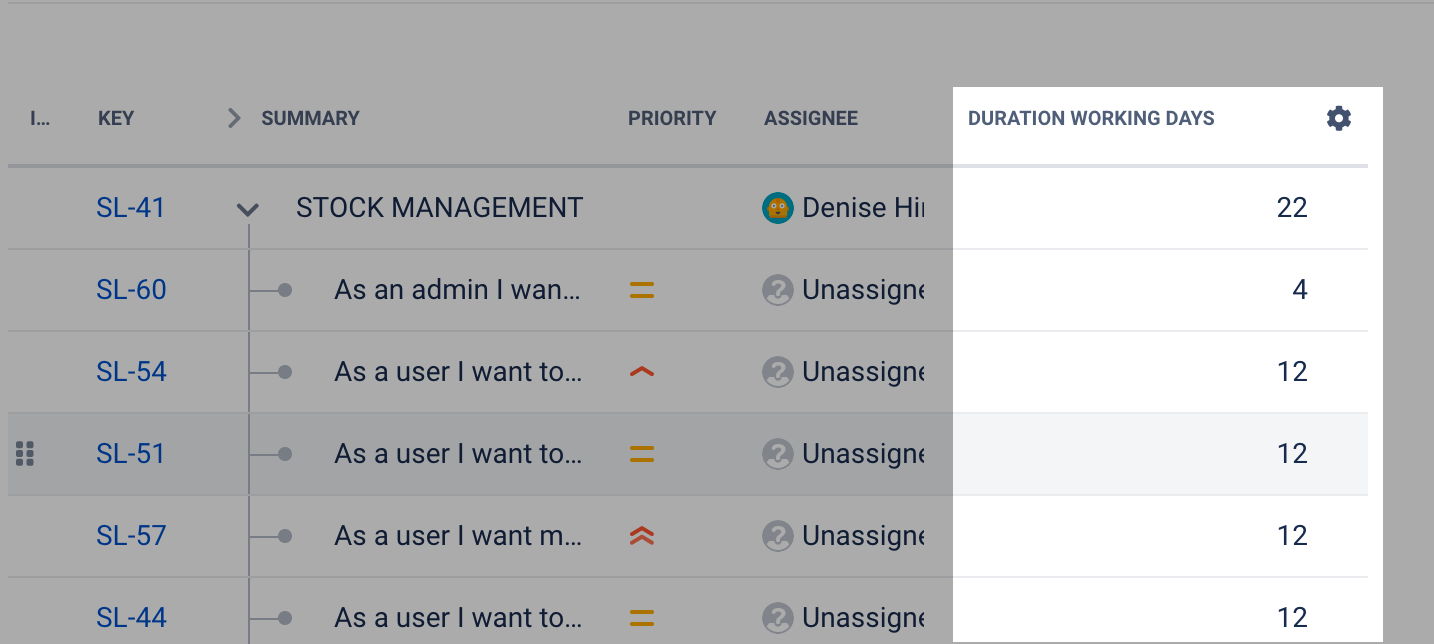
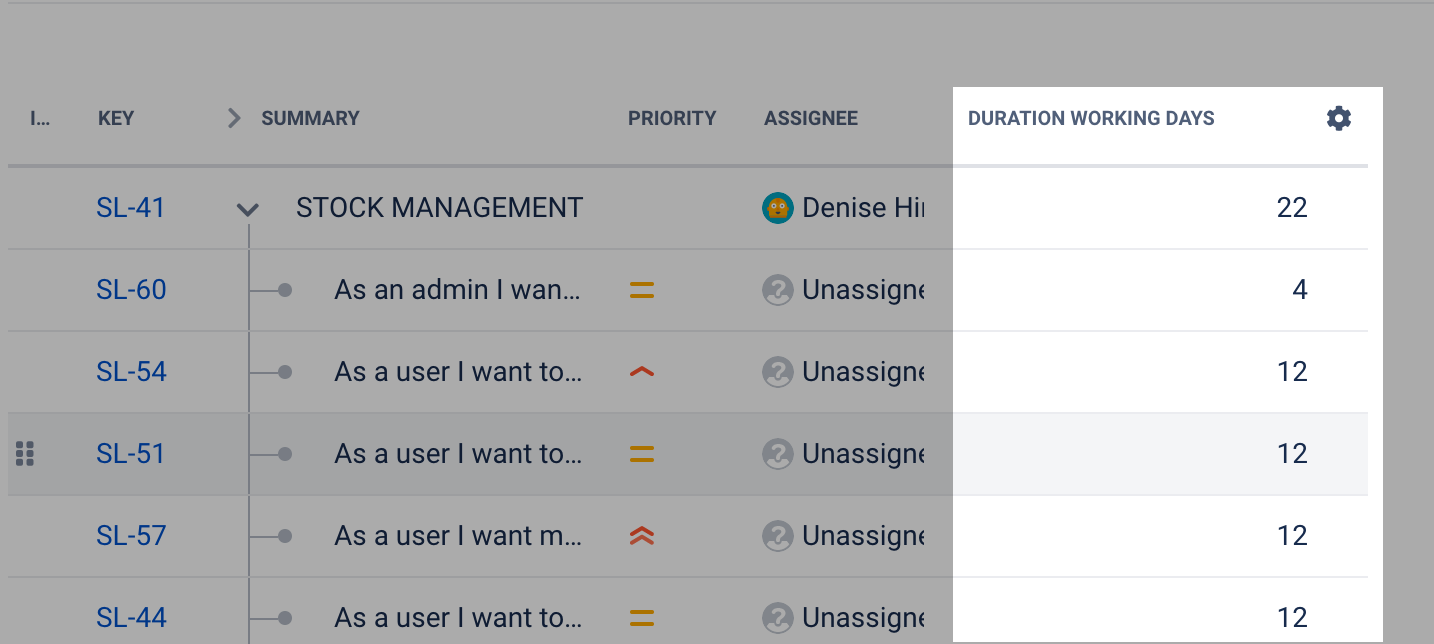
Conduct duration-based planning more easily - In most cases, telling how long a task will take is necessary to define the actual start and end date. That’s why duration-based planning in BigPicture is becoming more intuitive and time-efficient. You can edit the task duration field right on the Gantt chart (in the task-list columns).
Grey out irrelevant dependencies
Navigate dependency networks with greater clarity - While working on projects with a vast dependency network you need to know how every single task is connected with other items. Thanks to this smart UI tweak, whenever you mark a specific task on Gantt, all dependencies that are irrelevant to that task get greyed out – giving you a neat and clear view of the situation.
Inline editing of the assignee field
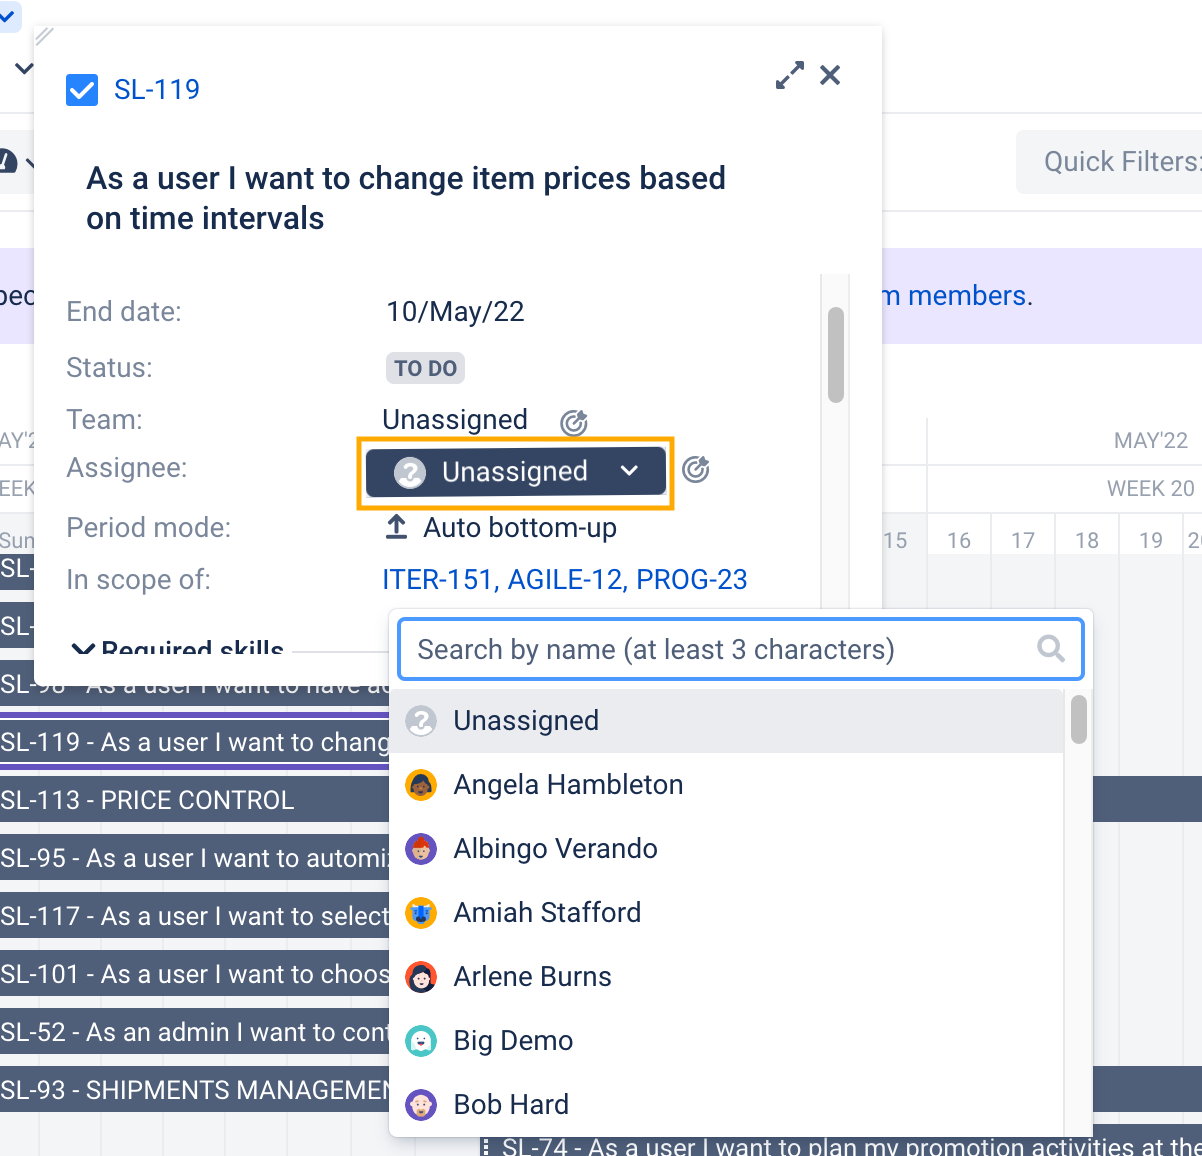
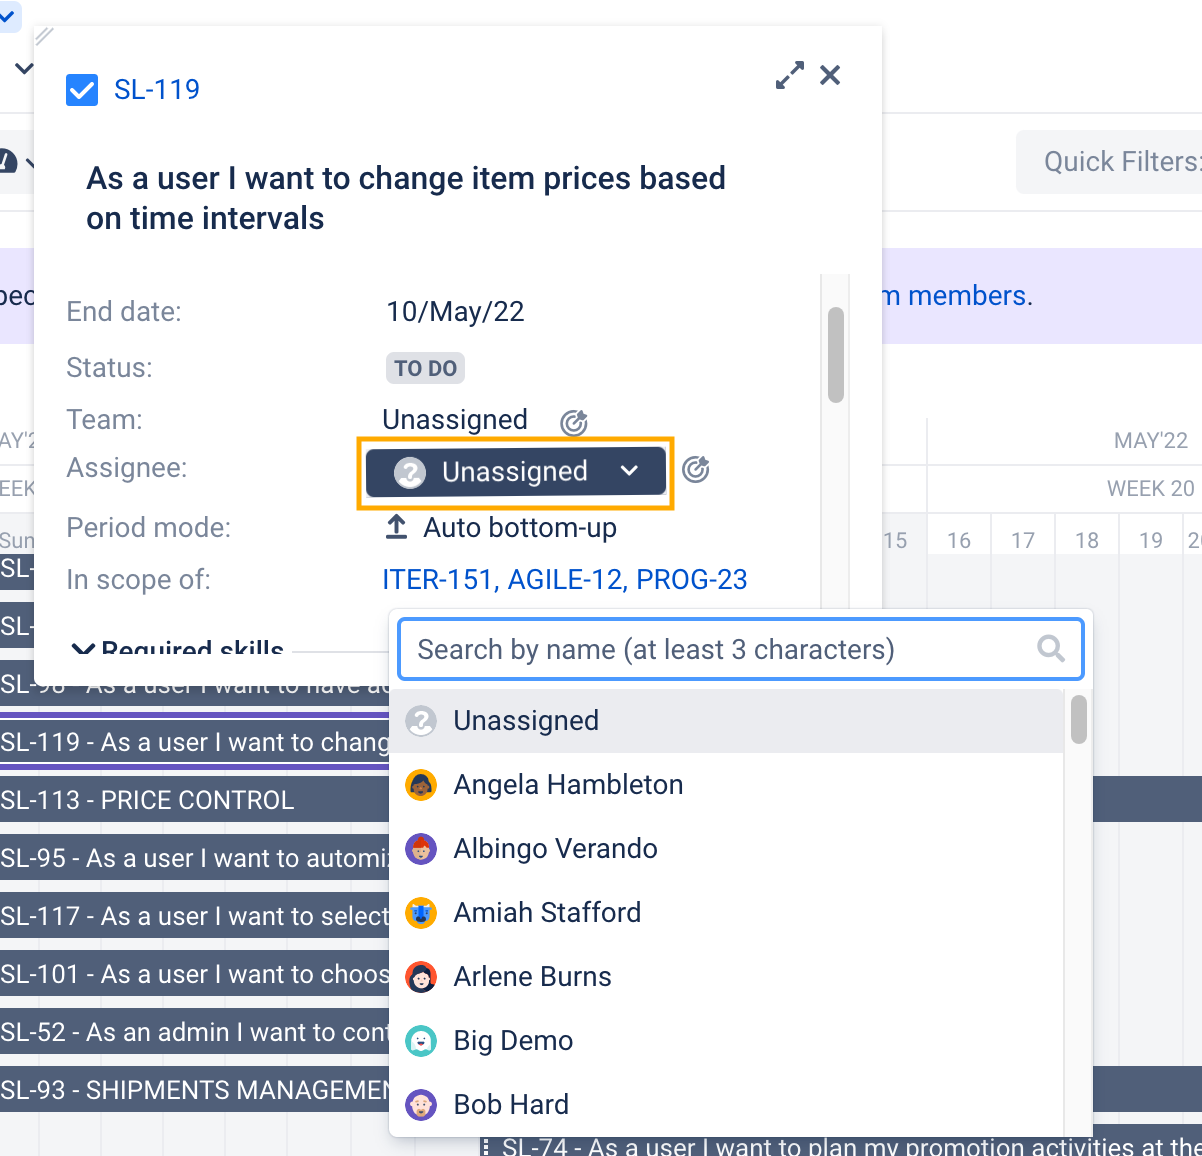
Reassign tasks directly in the Resources module - While managing resources, sometimes you may notice that some of them are overallocated and even see what particular tasks they are burdened with. Thanks to this UX improvement, you can reassign tasks right in the “workload details” window – without the risk of accidentally editing dates.
Handy period pickers
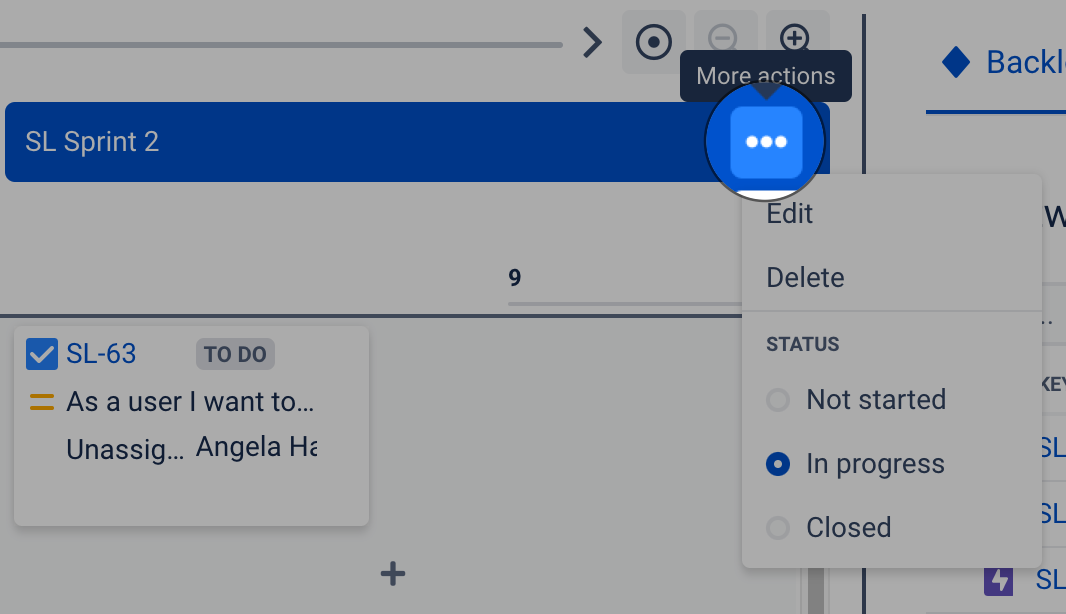
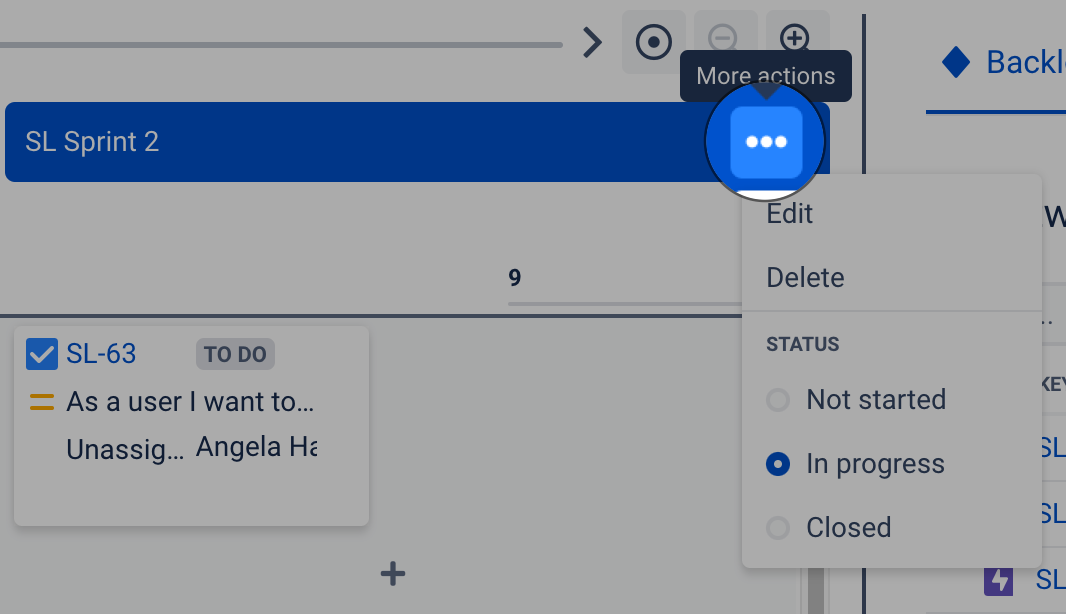
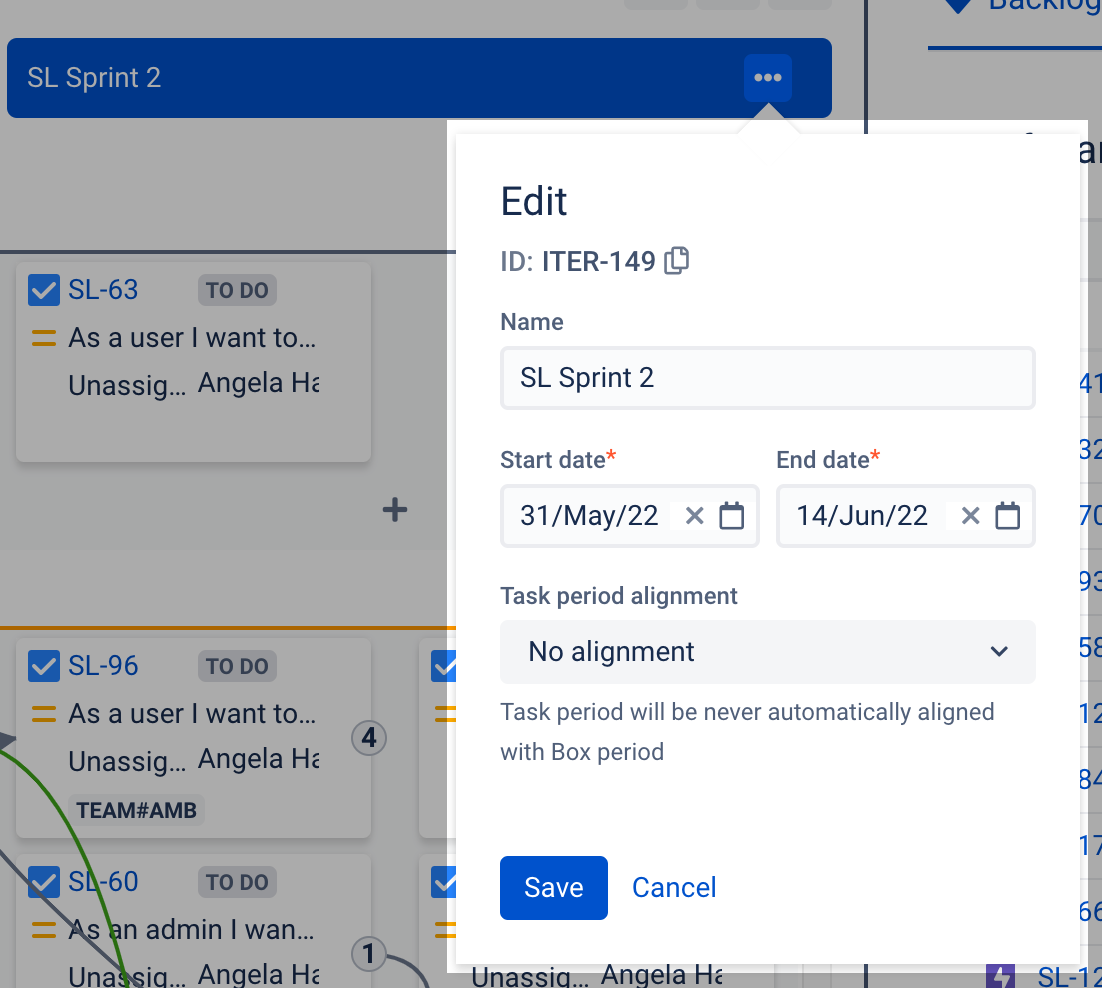
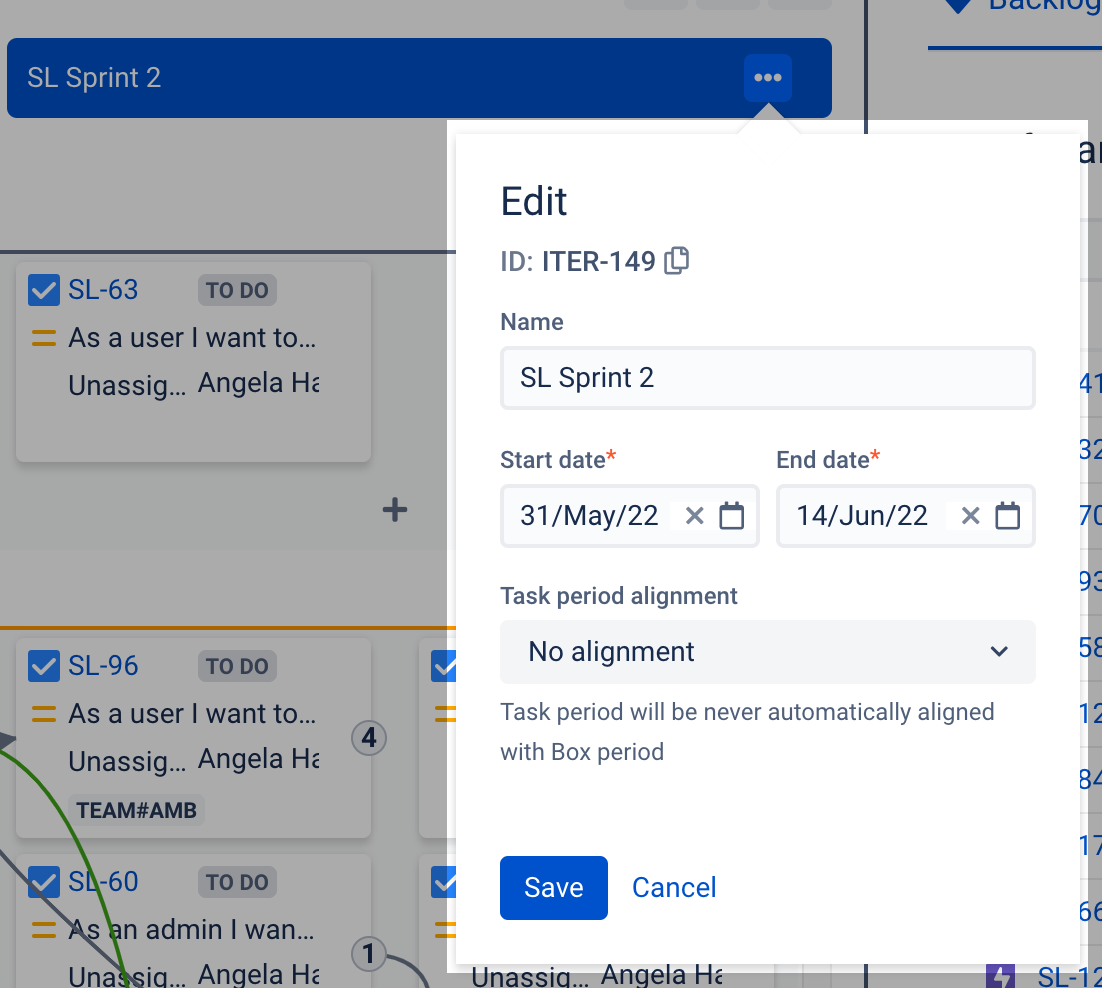
Set time ranges of your projects and other initiatives in just three clicks! - Why click five or more times when you can get the same result in just three clicks? When you create or edit a project or whatever other items you use for organizing work in the Overview module or in other modules without children items, you can set their time ranges by just marking them on the compact calendar grid – the period picker.
Contextual access to scope definition
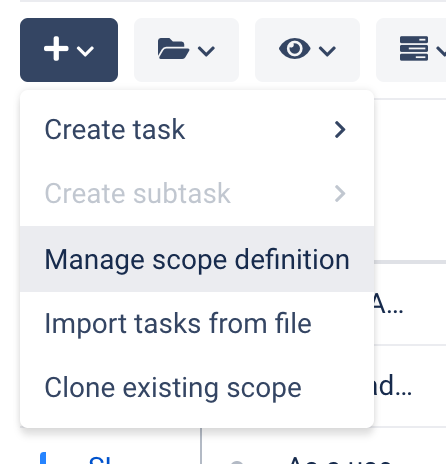
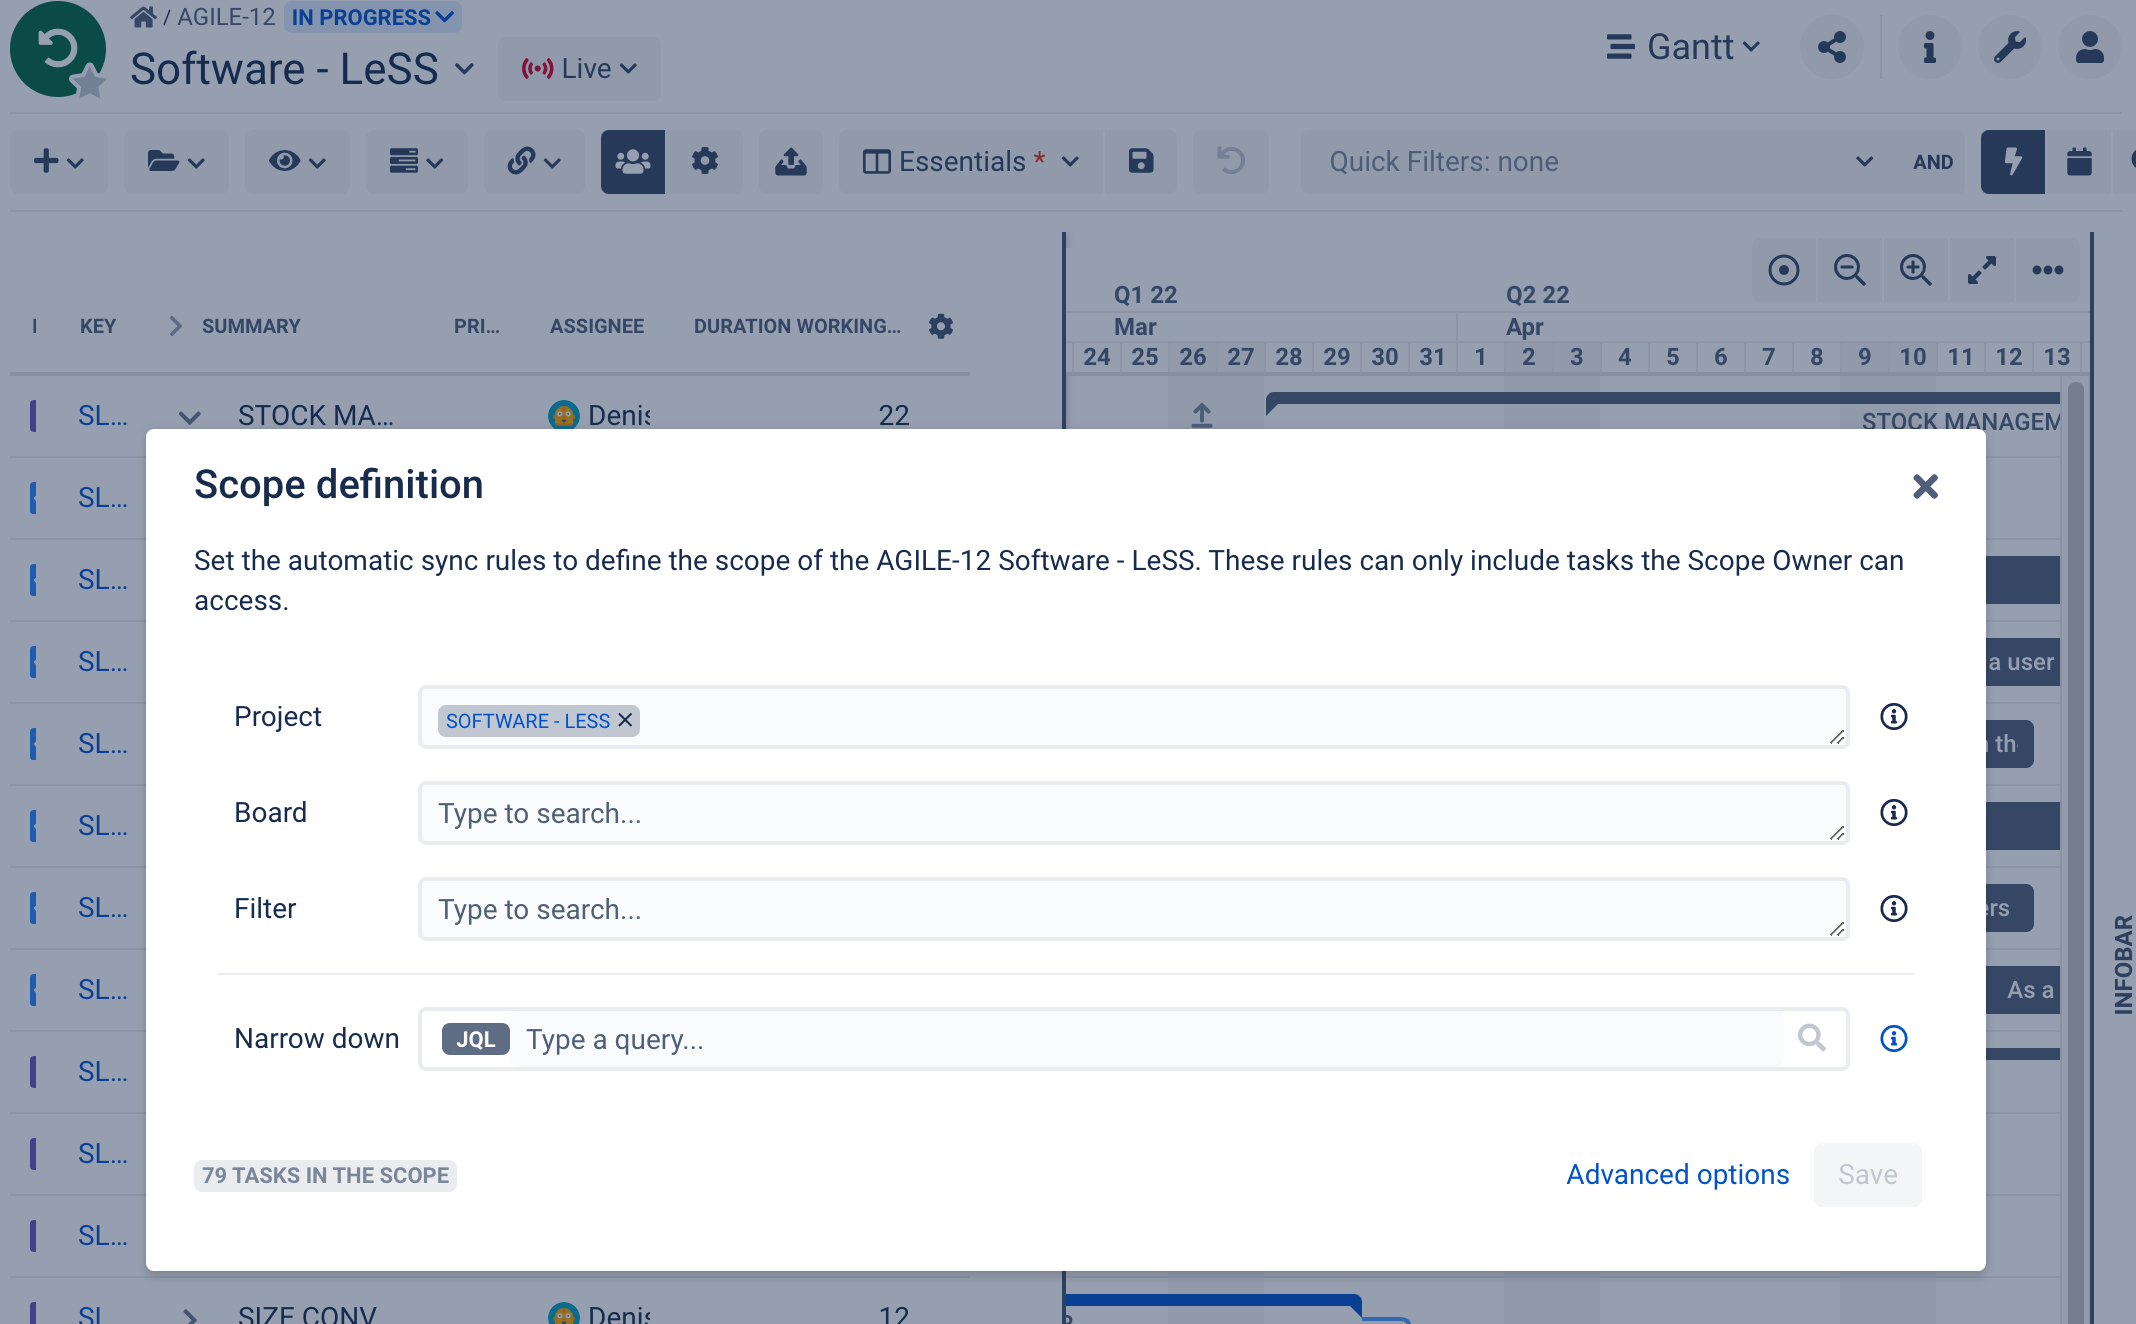
Access the Scope Definition screen in contextually relevant places - The scope definition screen; the one where you specify what range of tasks is included in an initiative – is becoming more accessible. Now, you can open it in all those places where defining an initiative’s scope is necessary, like an empty project. Consequently, you can easily preview your Scope Definition settings and adjust them incrementally.
Allocation insights in the Resources panel (Gantt module)
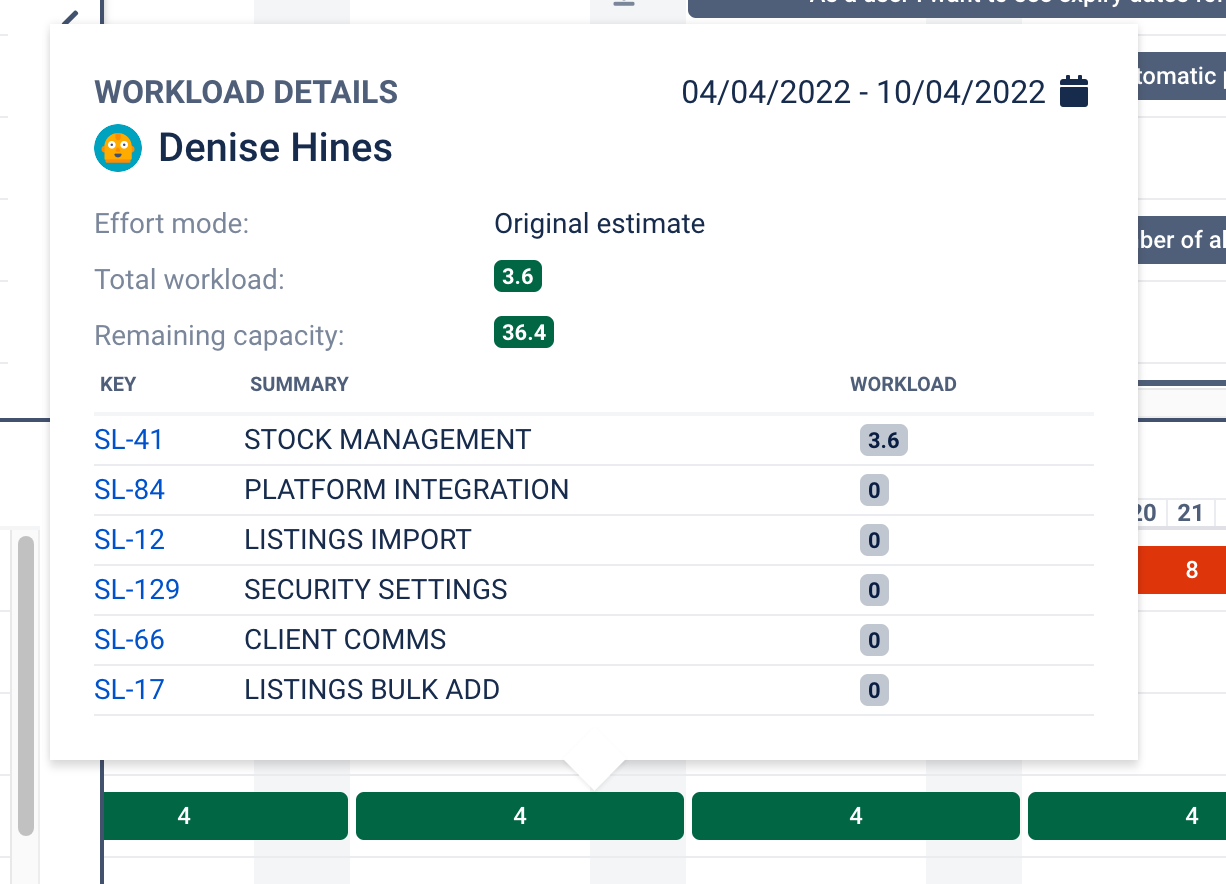
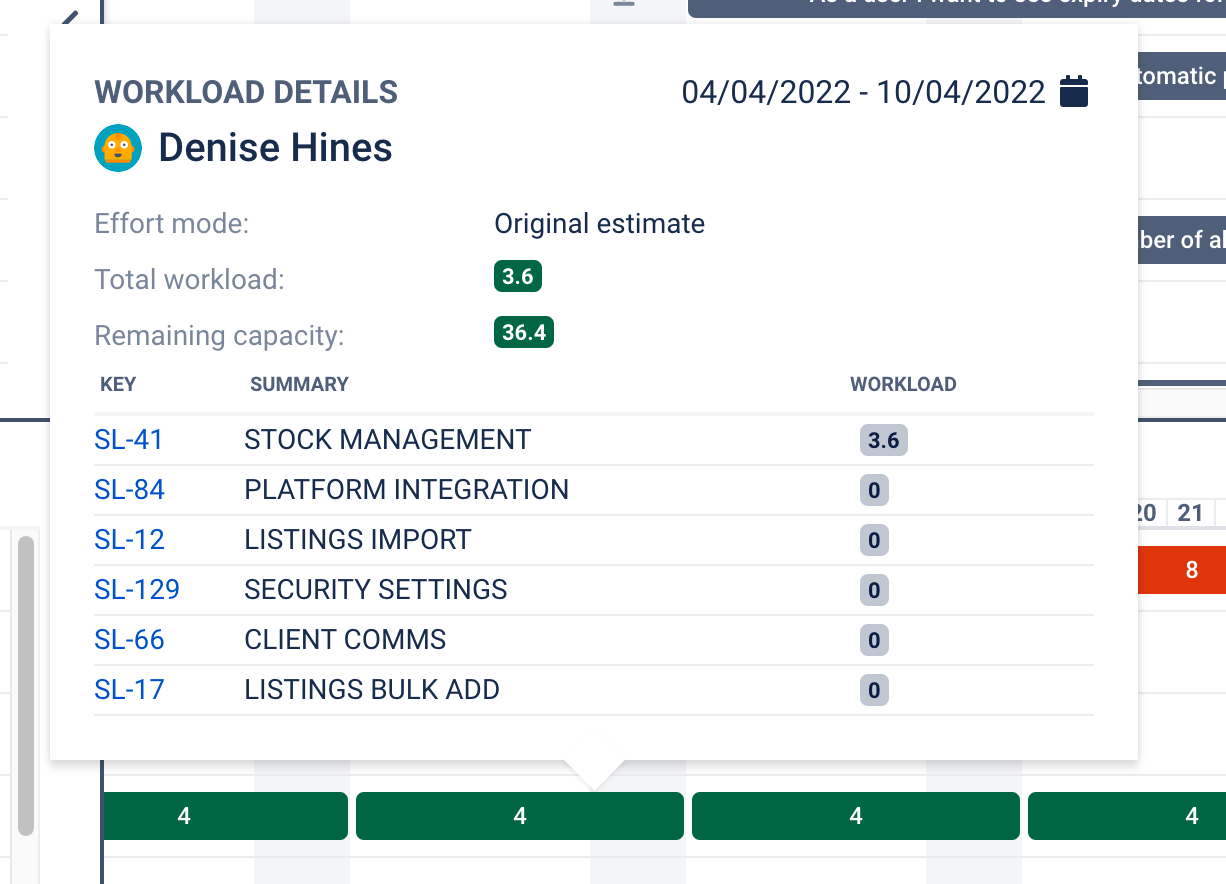
Monitor resource allocation on Gantt in a more knowledgeable way- Numbers on color-coded cells of the Gantt module’s Resources panel have always been an enigma to new users. In fact, checking why a resource was overloaded required visiting the Resources panel. Now, you can display details such as effort mode, total workload, and remaining capacity of a resource right in the Resources panel of the Gantt module.
Category | Feature description | Sneak peek |
|---|---|---|
Navigation and layout | Board Module Box operations and information are hidden under the three-dot menu. |
Reports Module Task report redesigned. | |
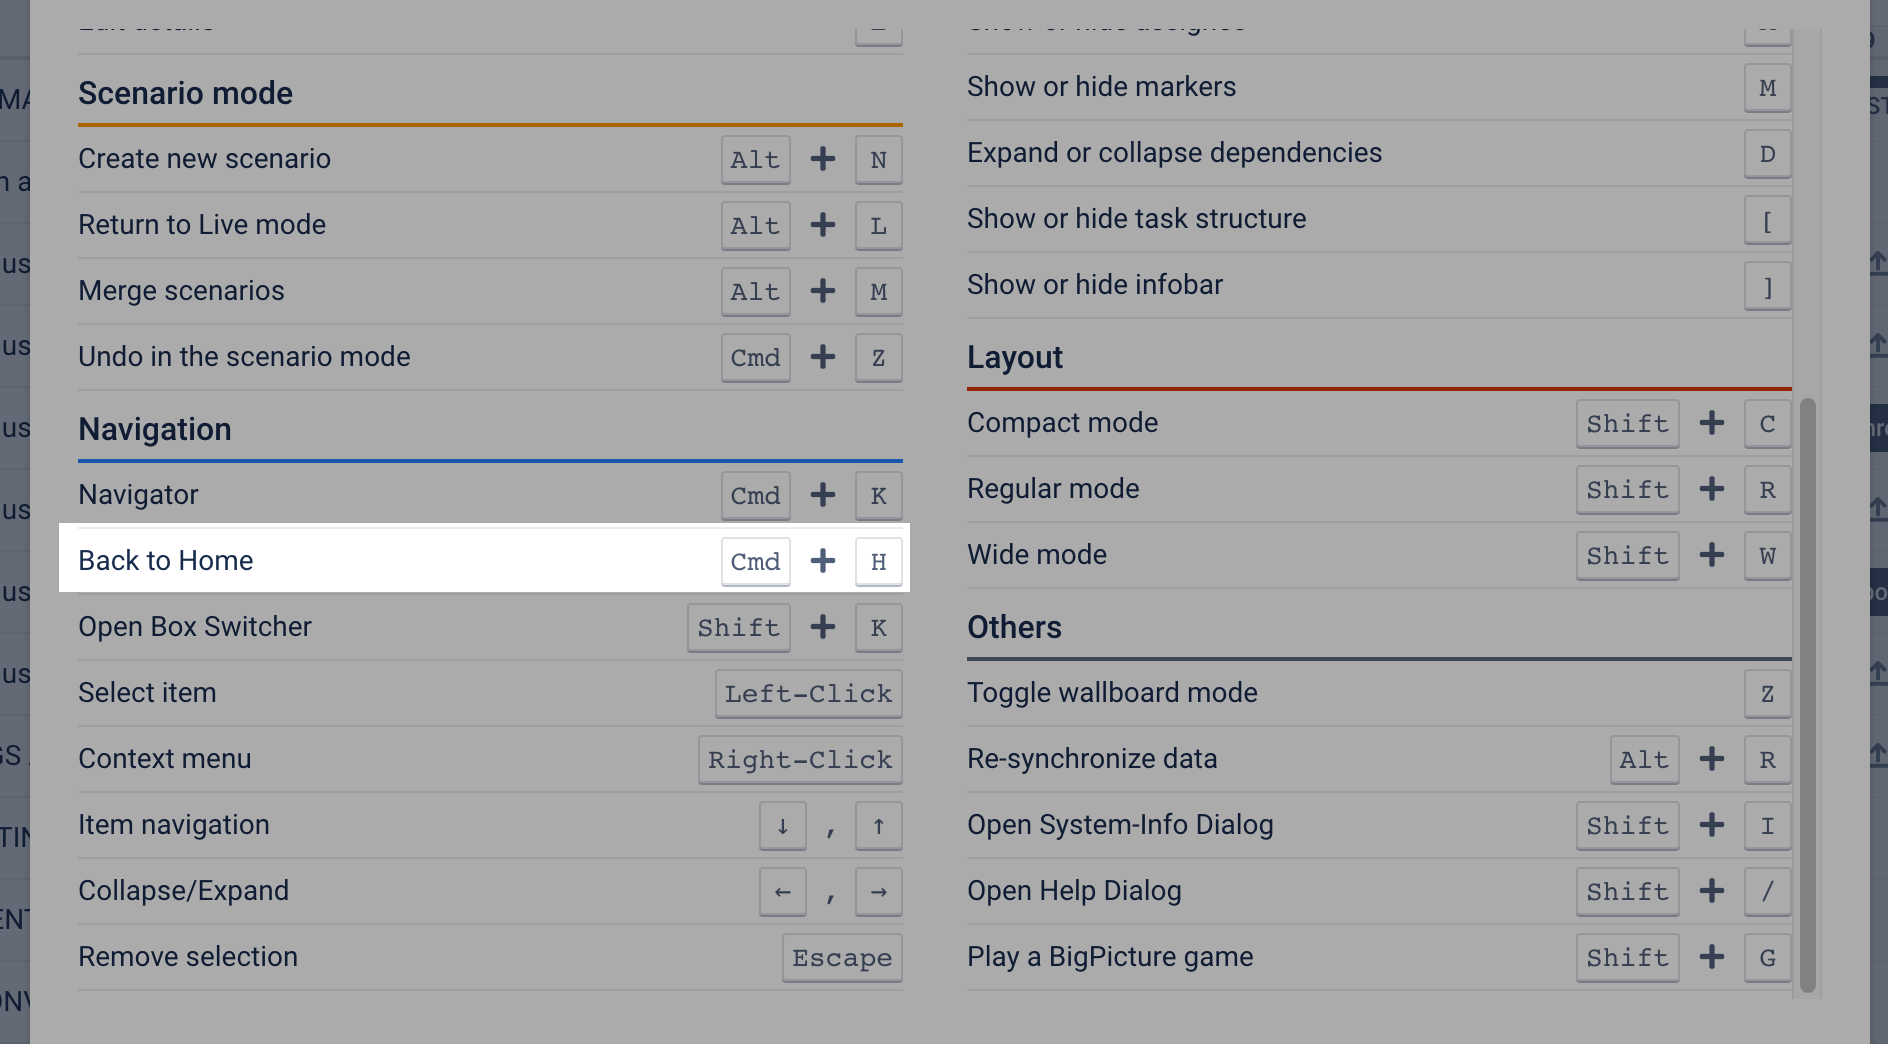
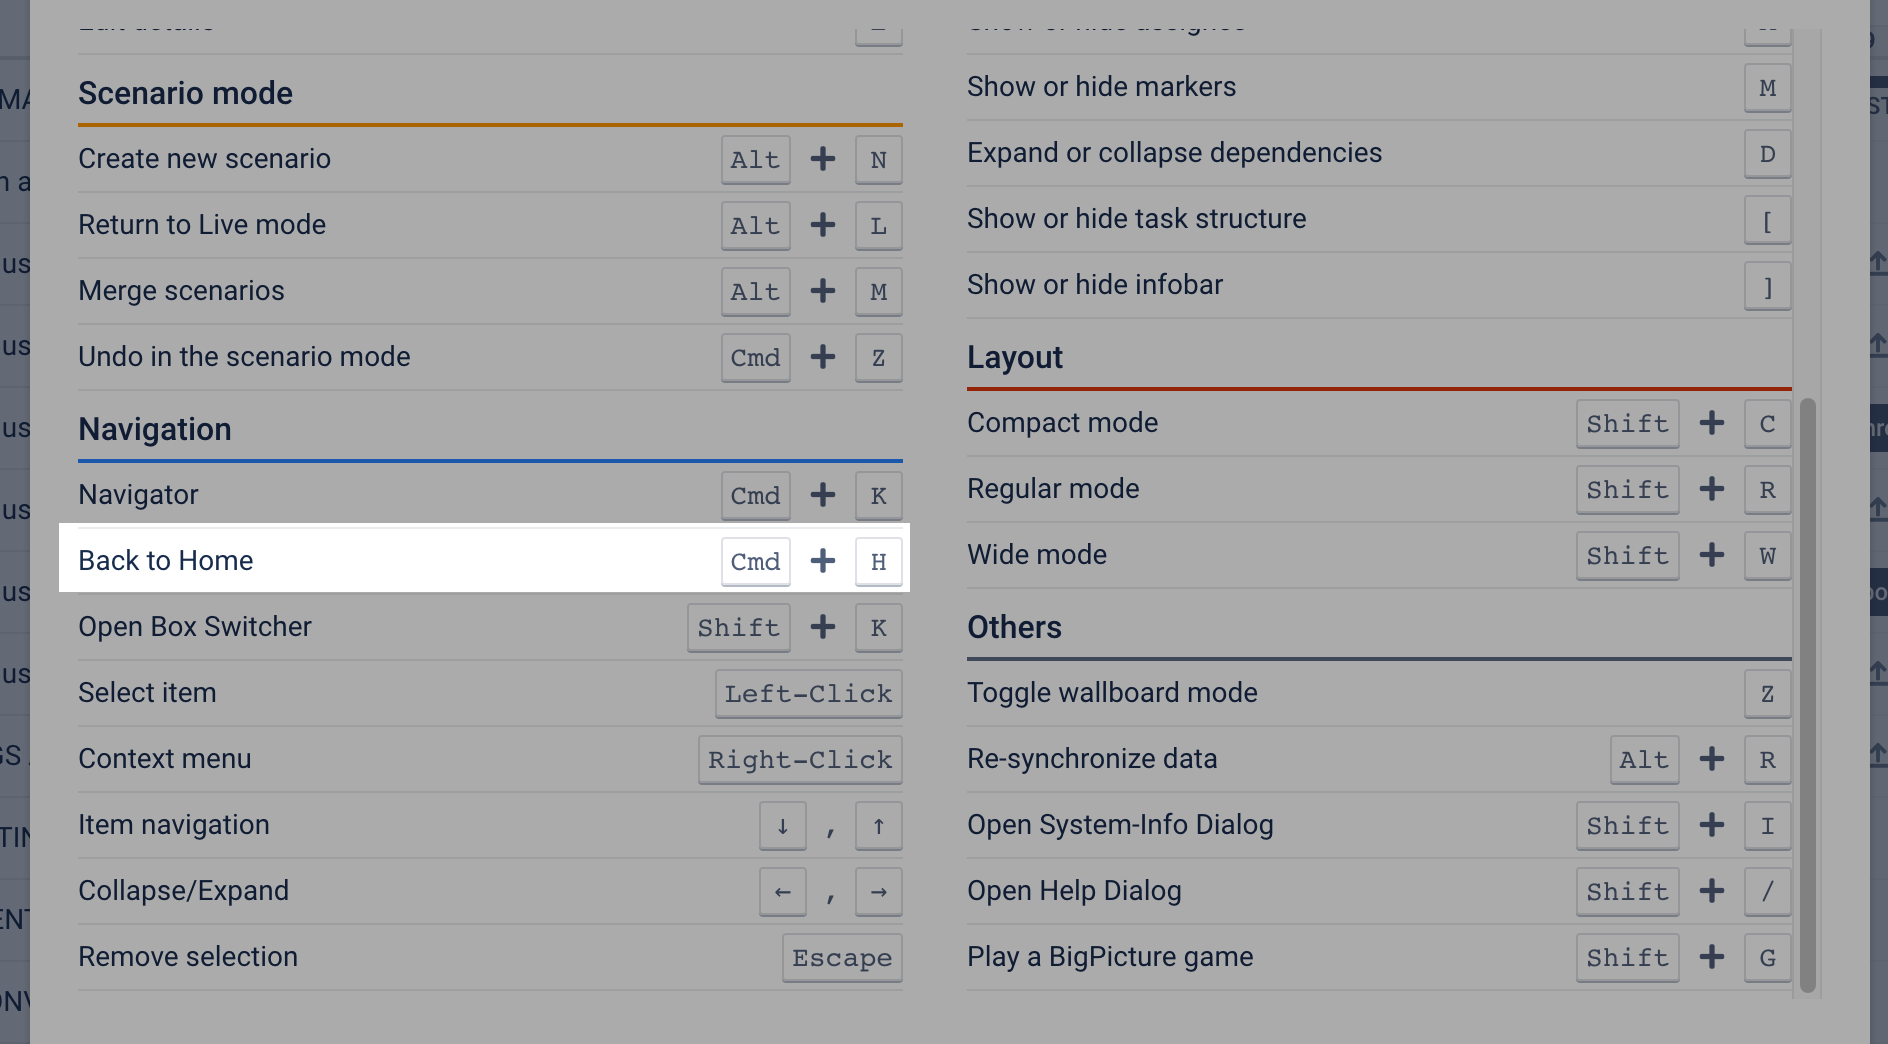
Keyboard shortcuts Shortcut added - takes a user back to the Home (root) box.
|
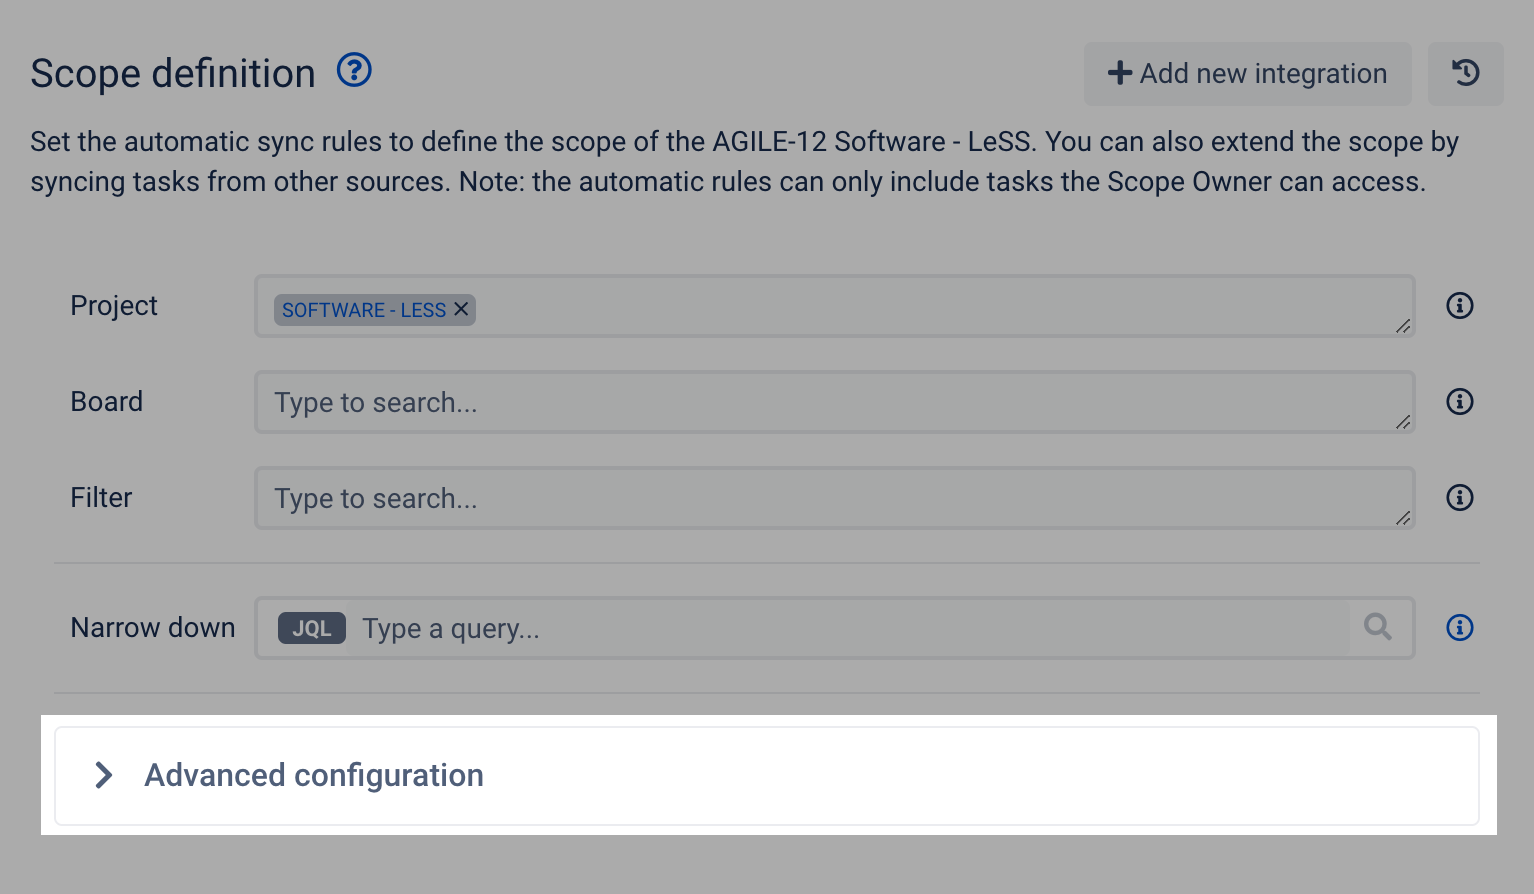
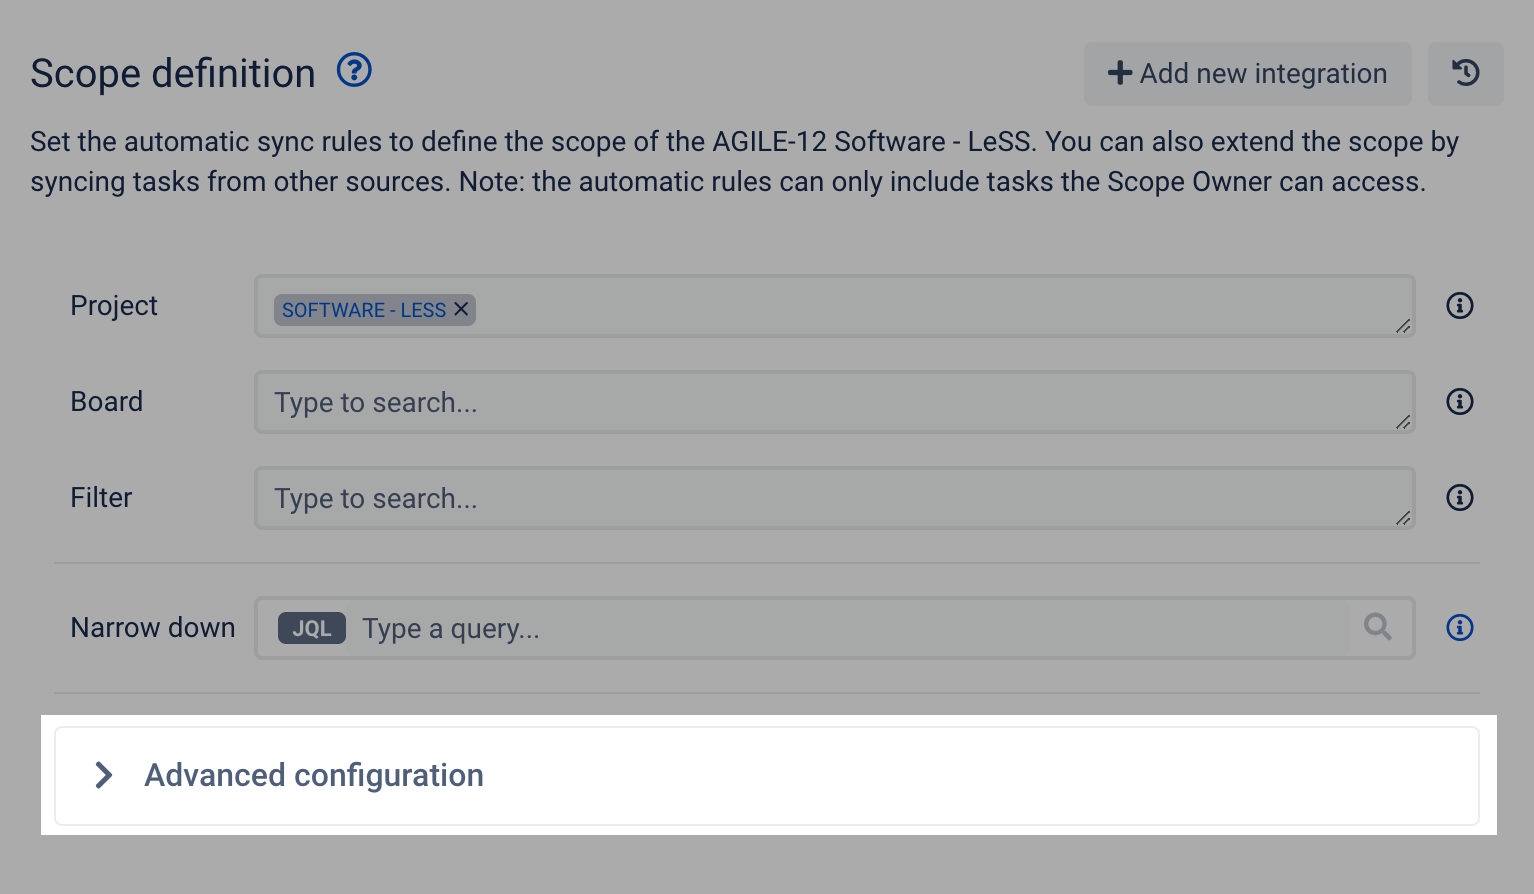
Scope definition Less frequently used settings are hidden by default (Scope Owner, Task types). |
Scope definition settings can be accessed from modules (pop-up) Basic scope definition settings can be reviewed and edited without going to the box configuration screen.
|
|
|
Inline editing | Inline editing - duration (working days) The "Duration working days" field value can be edited in the column views of modules. The change triggers a recalculation of the task duration - the end date is adjusted. |
Inline editing - assignee field (task details dialogue - resources module) The assignee field in the task detail dialog can be edited. |
Teams module - "memberships start date" can be edited (inline editing) | |
Teams module - "availability" can be edited (inline editing) | |
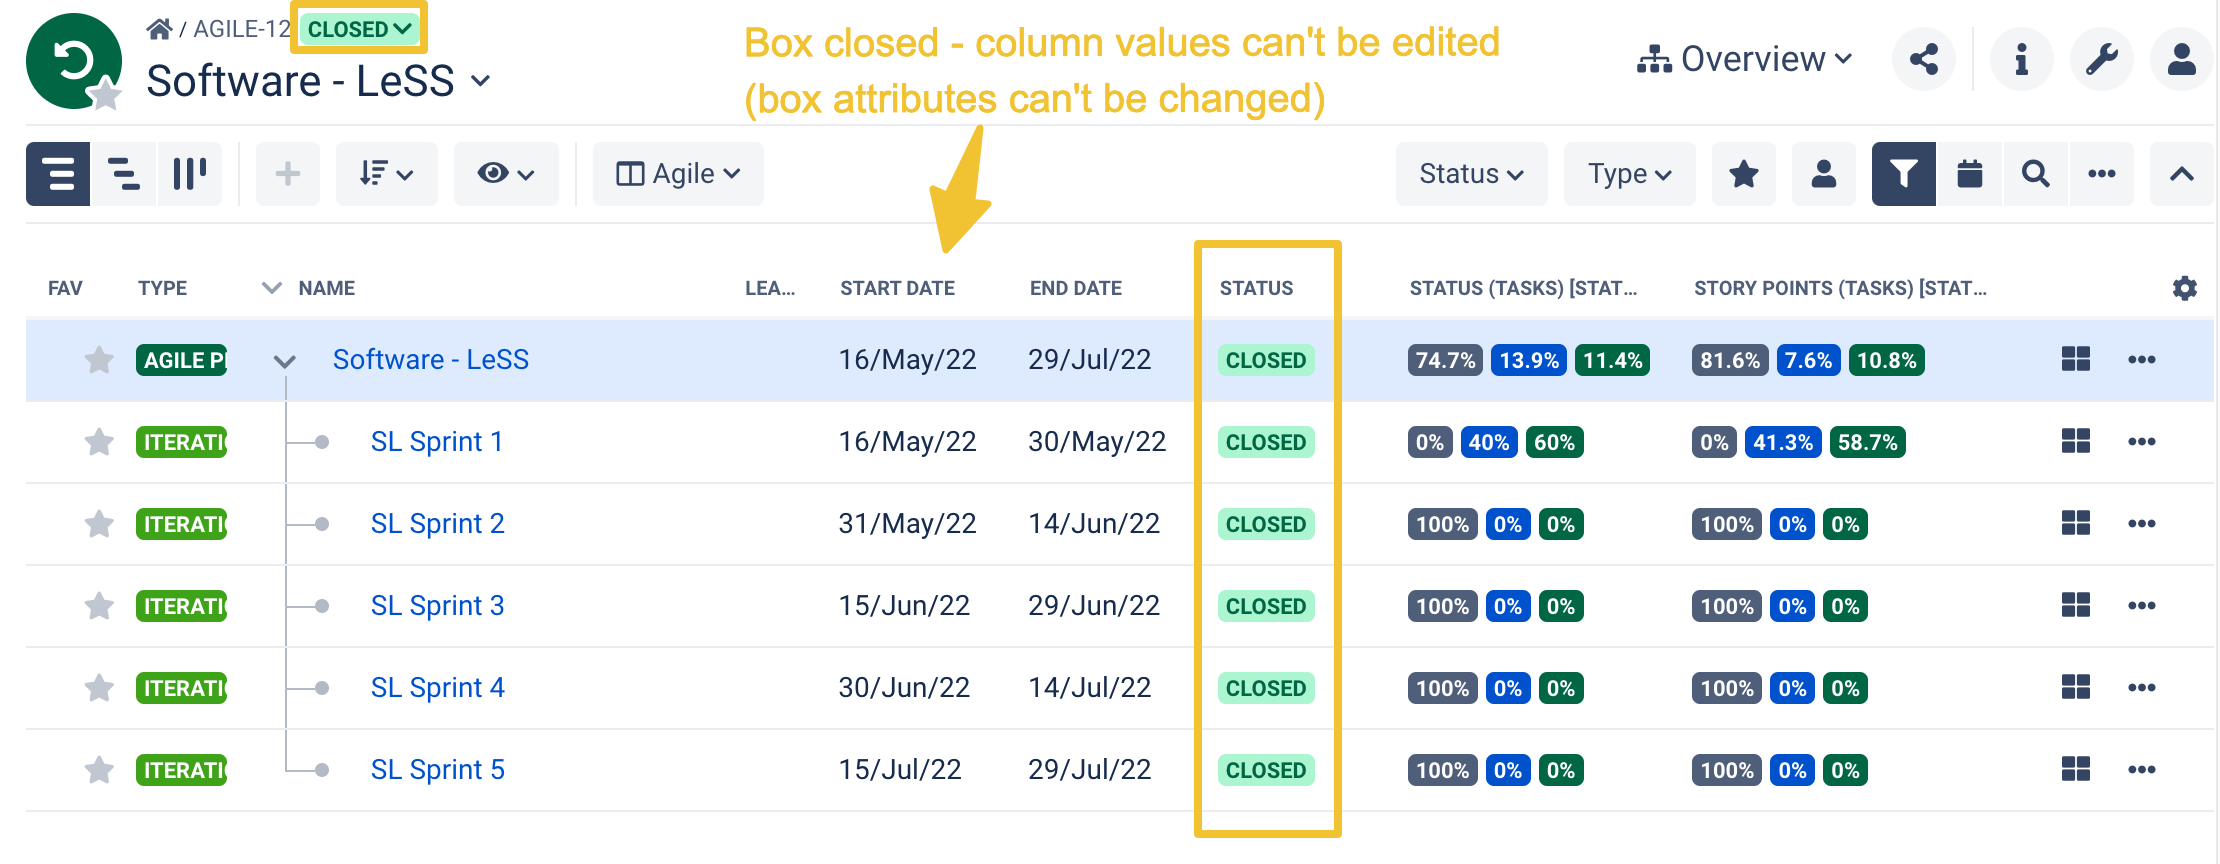
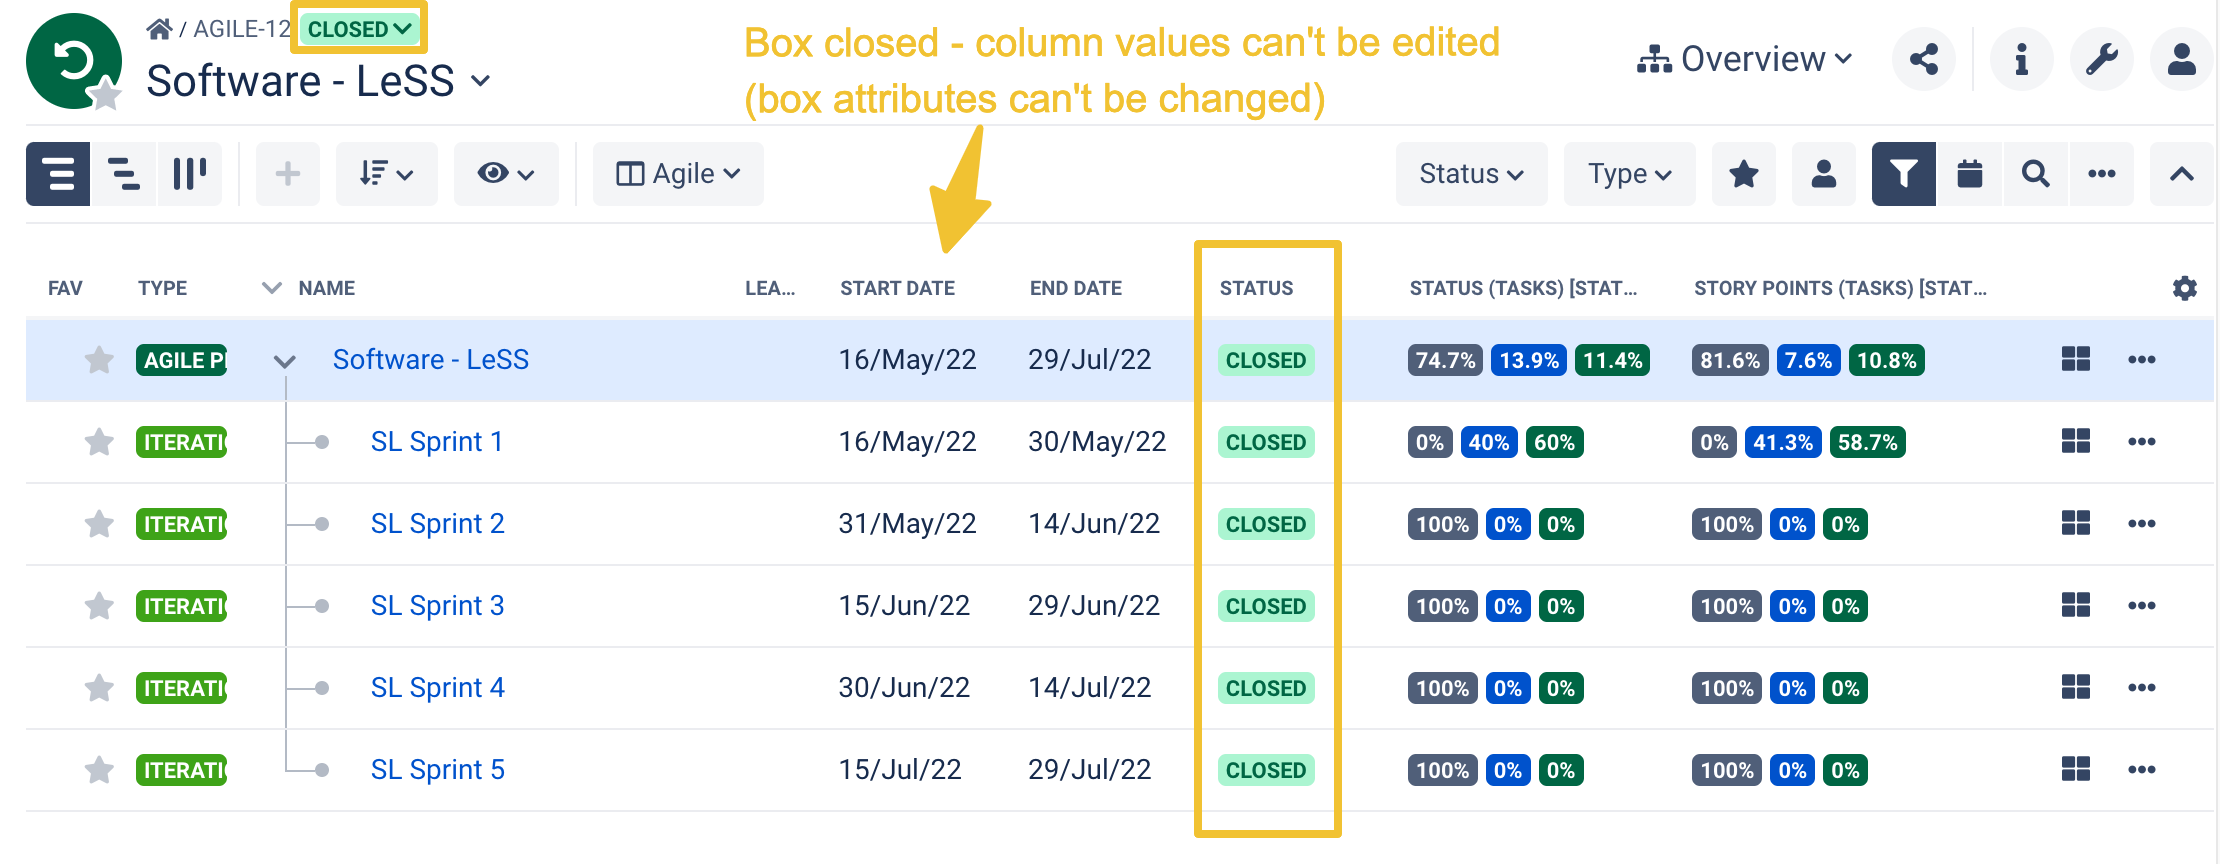
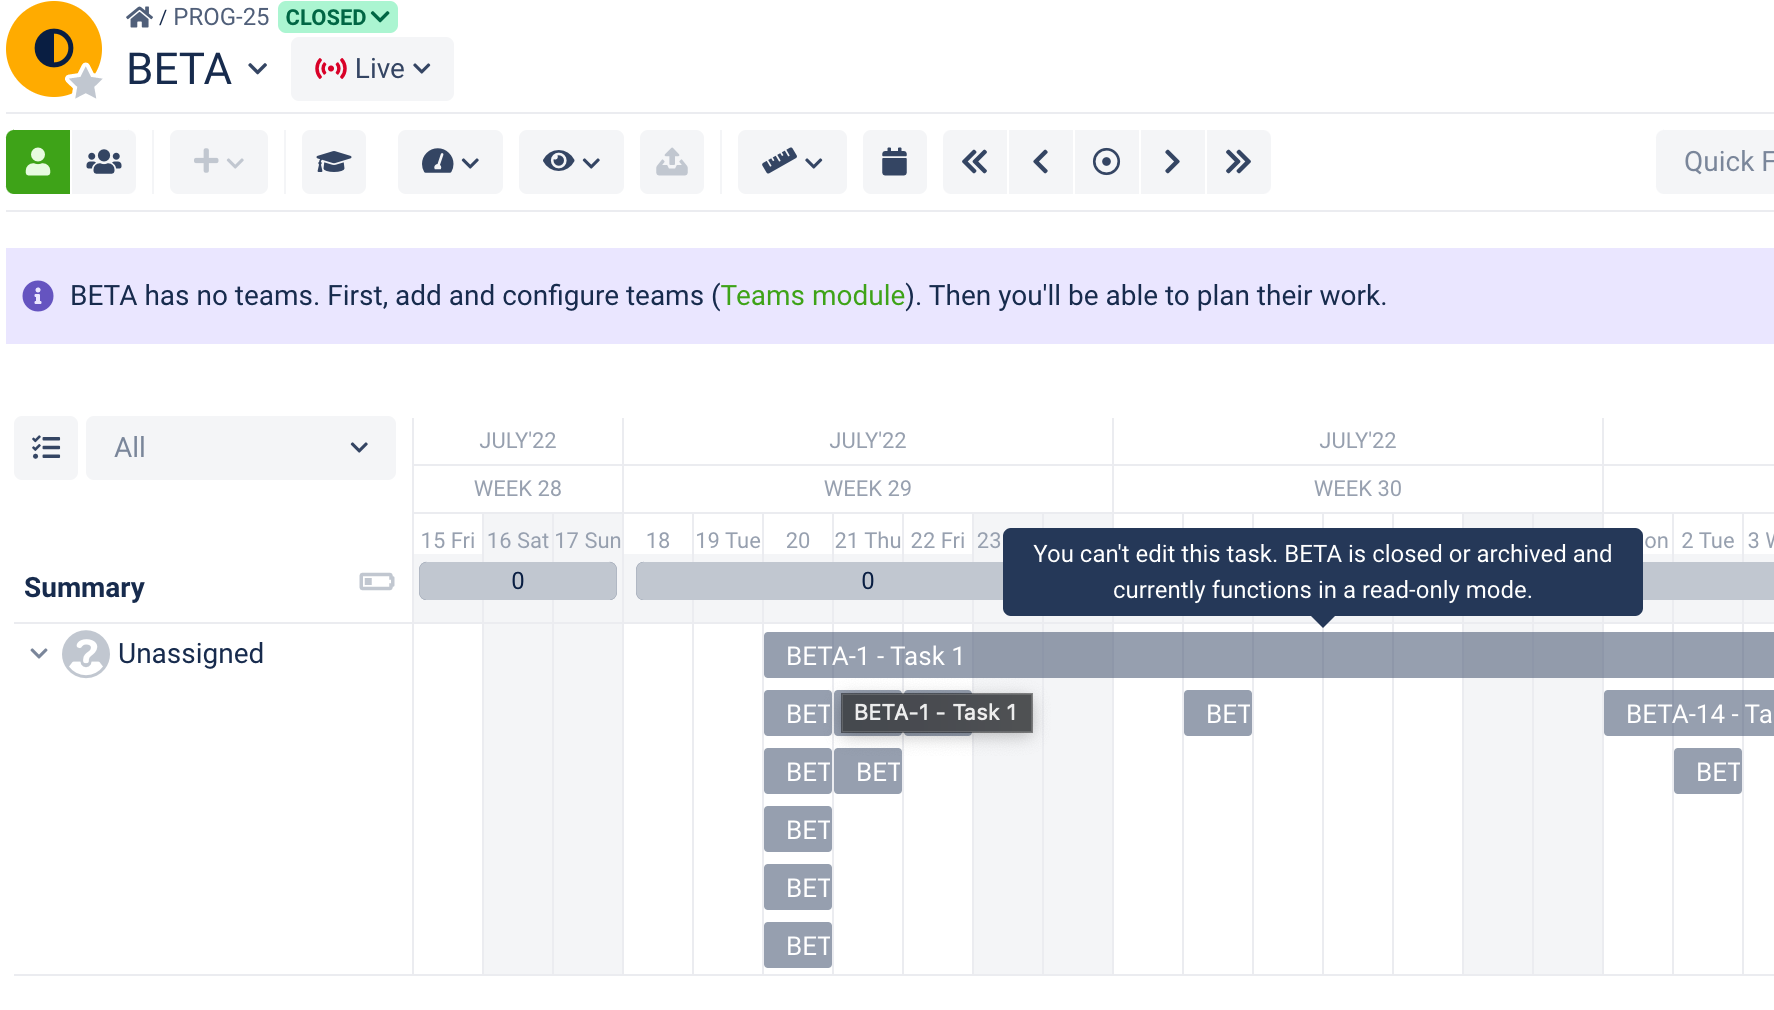
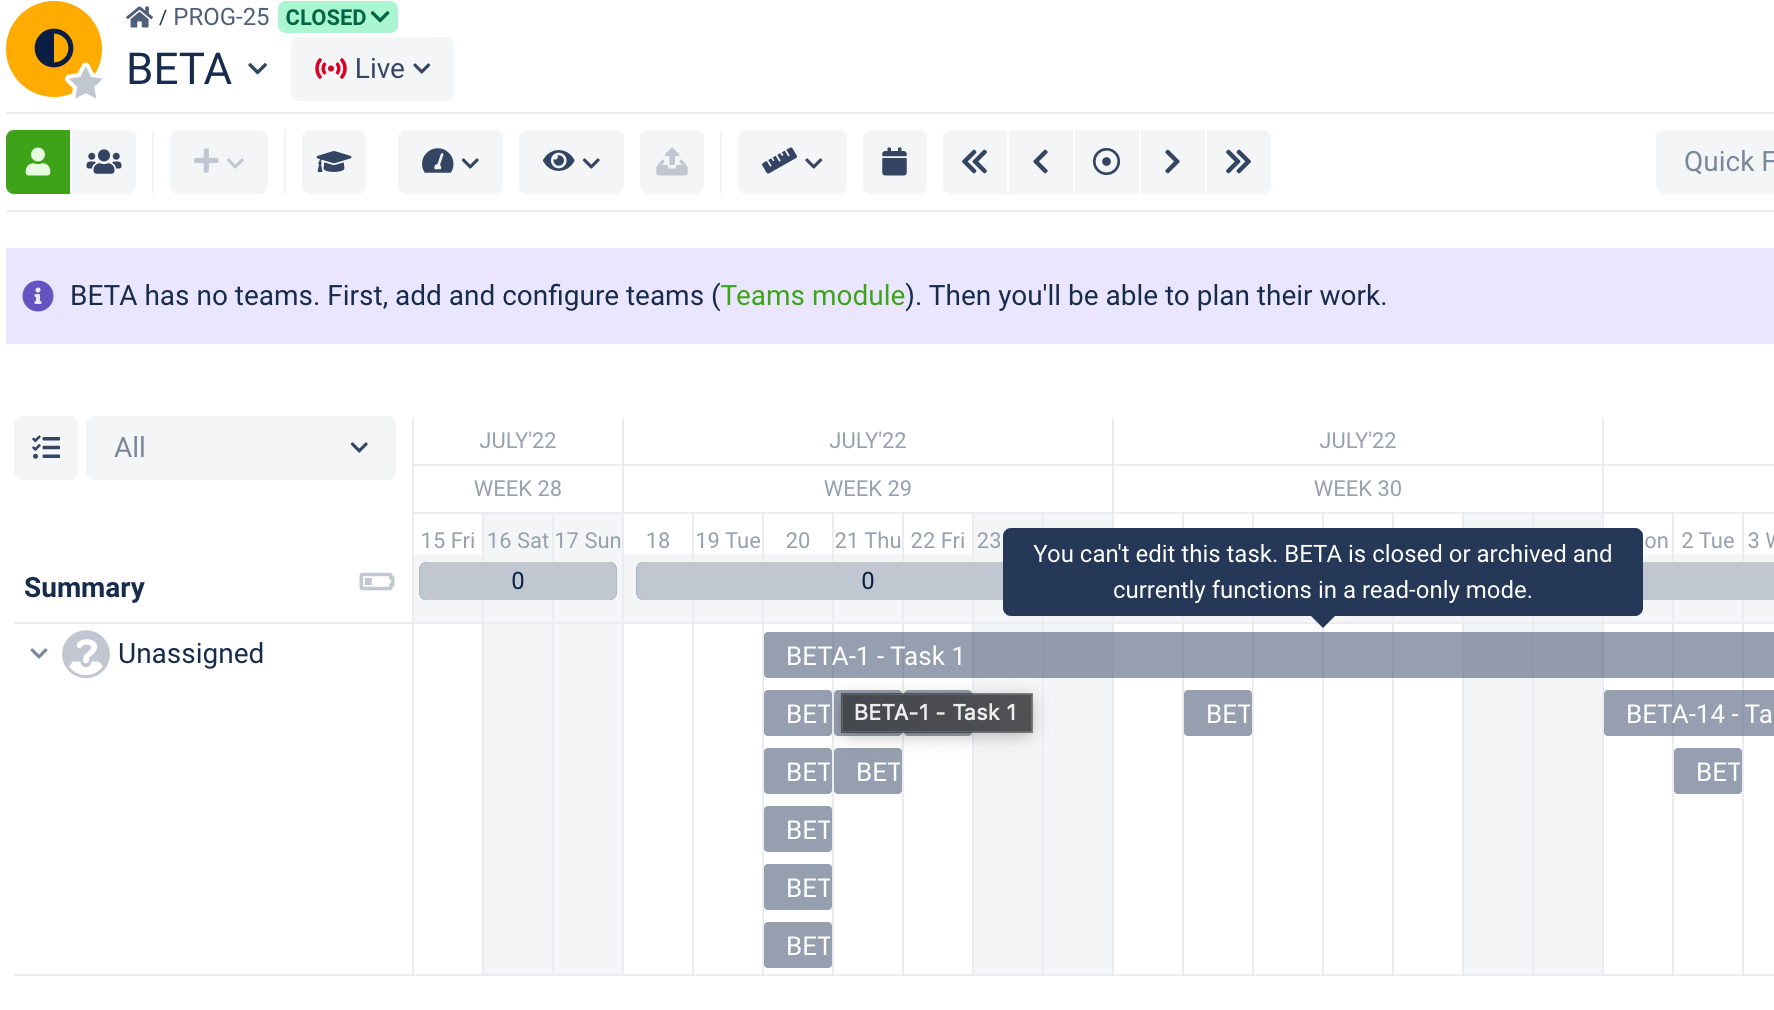
Closed and archived boxes | Inline editing - unavailable for closed and archived boxes Attributes of closed and archived boxes can't be changed using inline editing. |
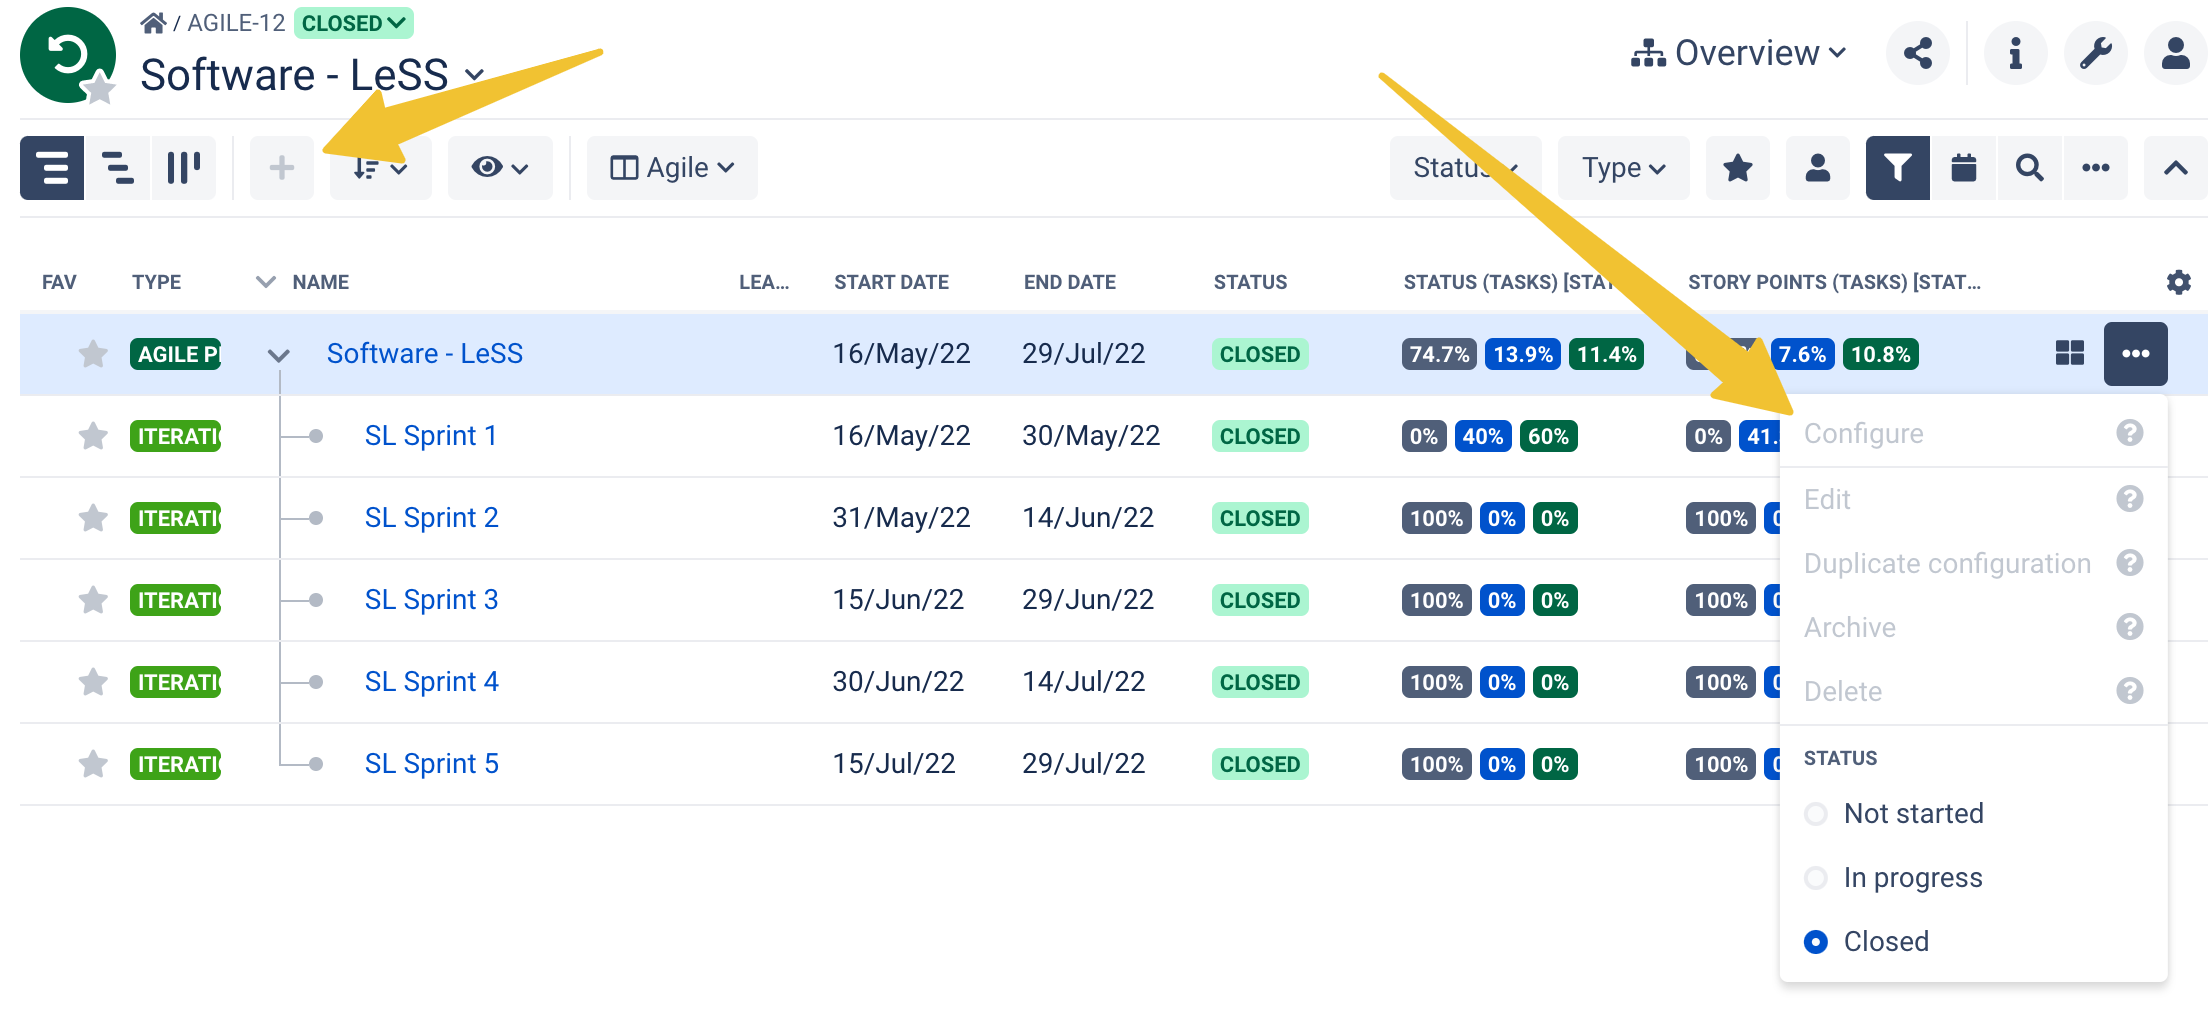
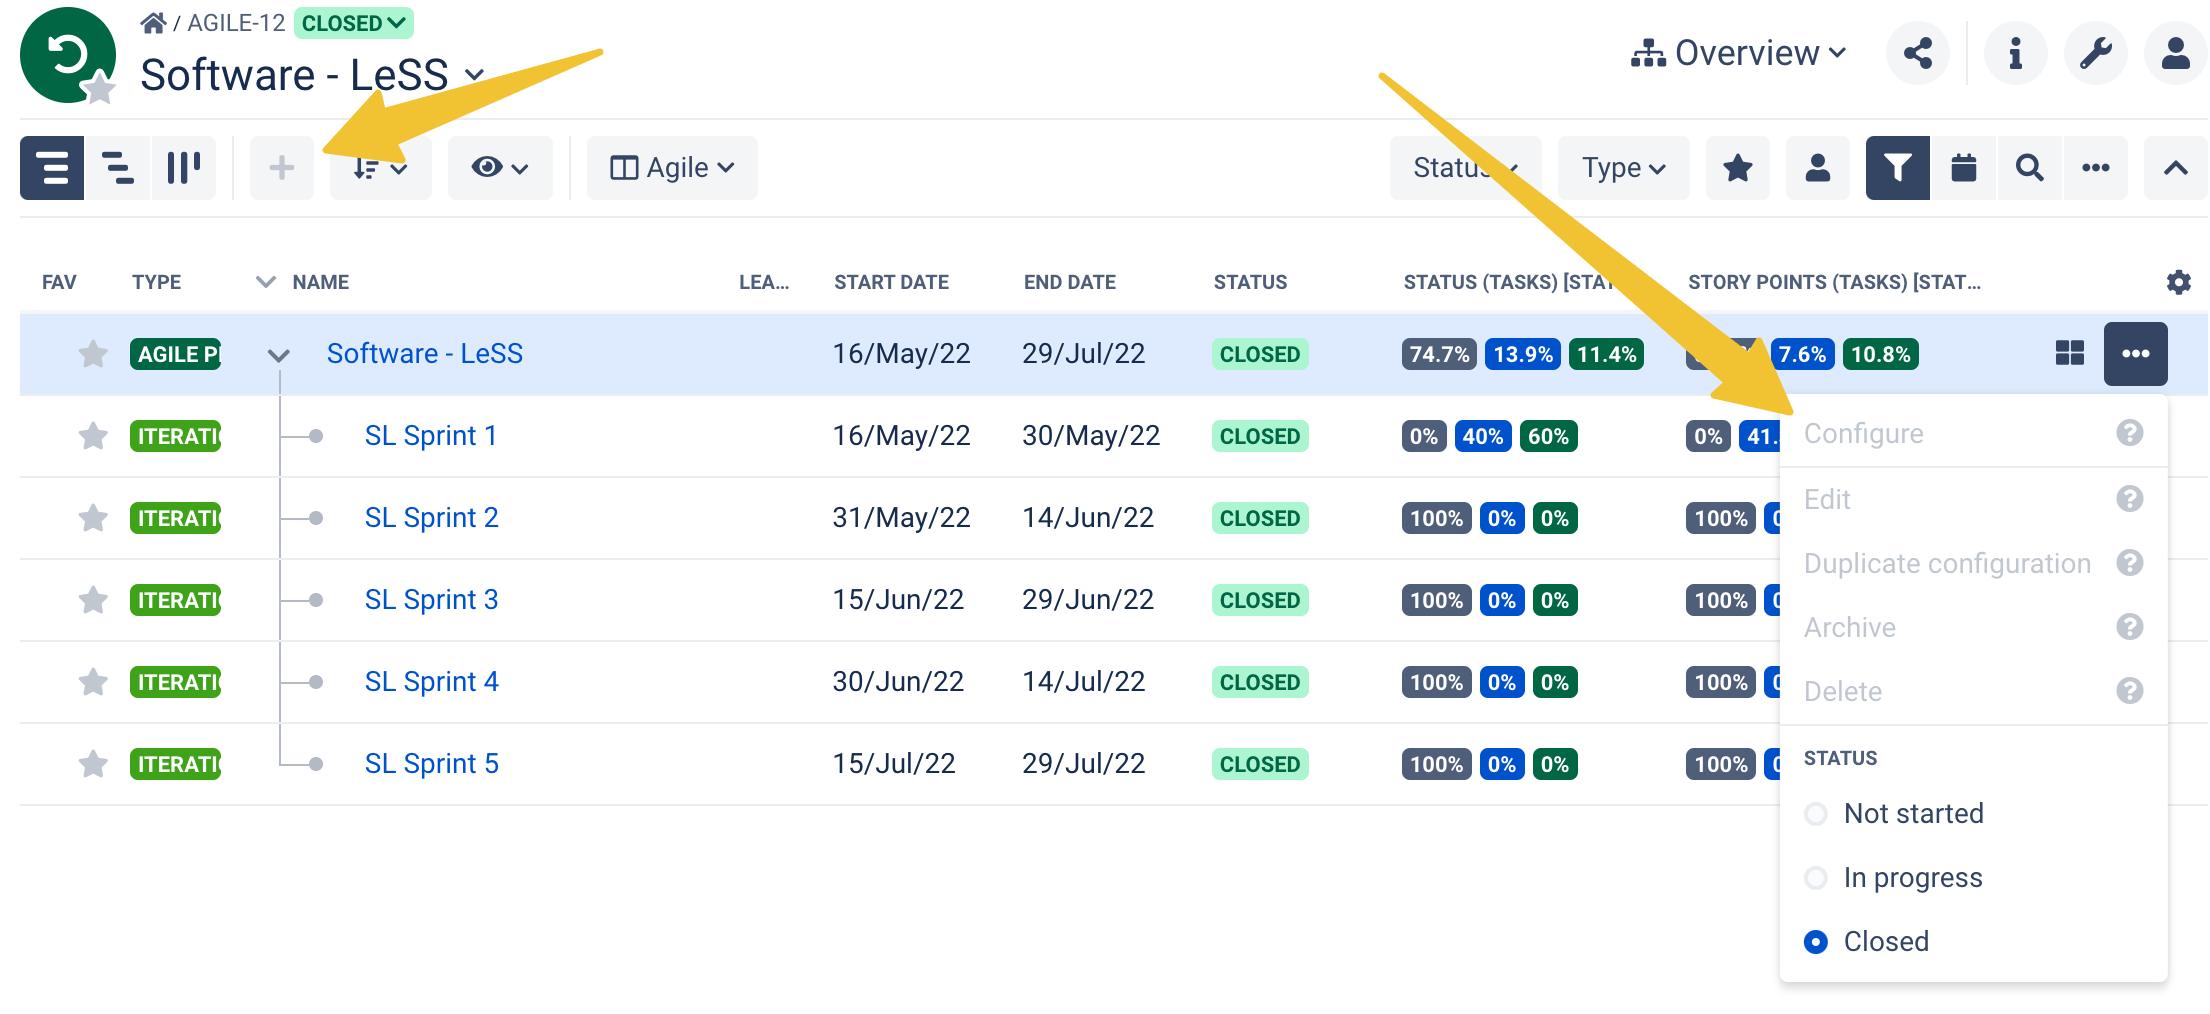
Closed boxes - action buttons disabled The restriction is applicable to all modules. Closed boxes function in read-only mode. |
Gantt module | Gantt module - Resources panel Workload details pop-up opens after clicking on a workload indicator. |
Category | Feature description | Sneak peek |
|---|---|---|
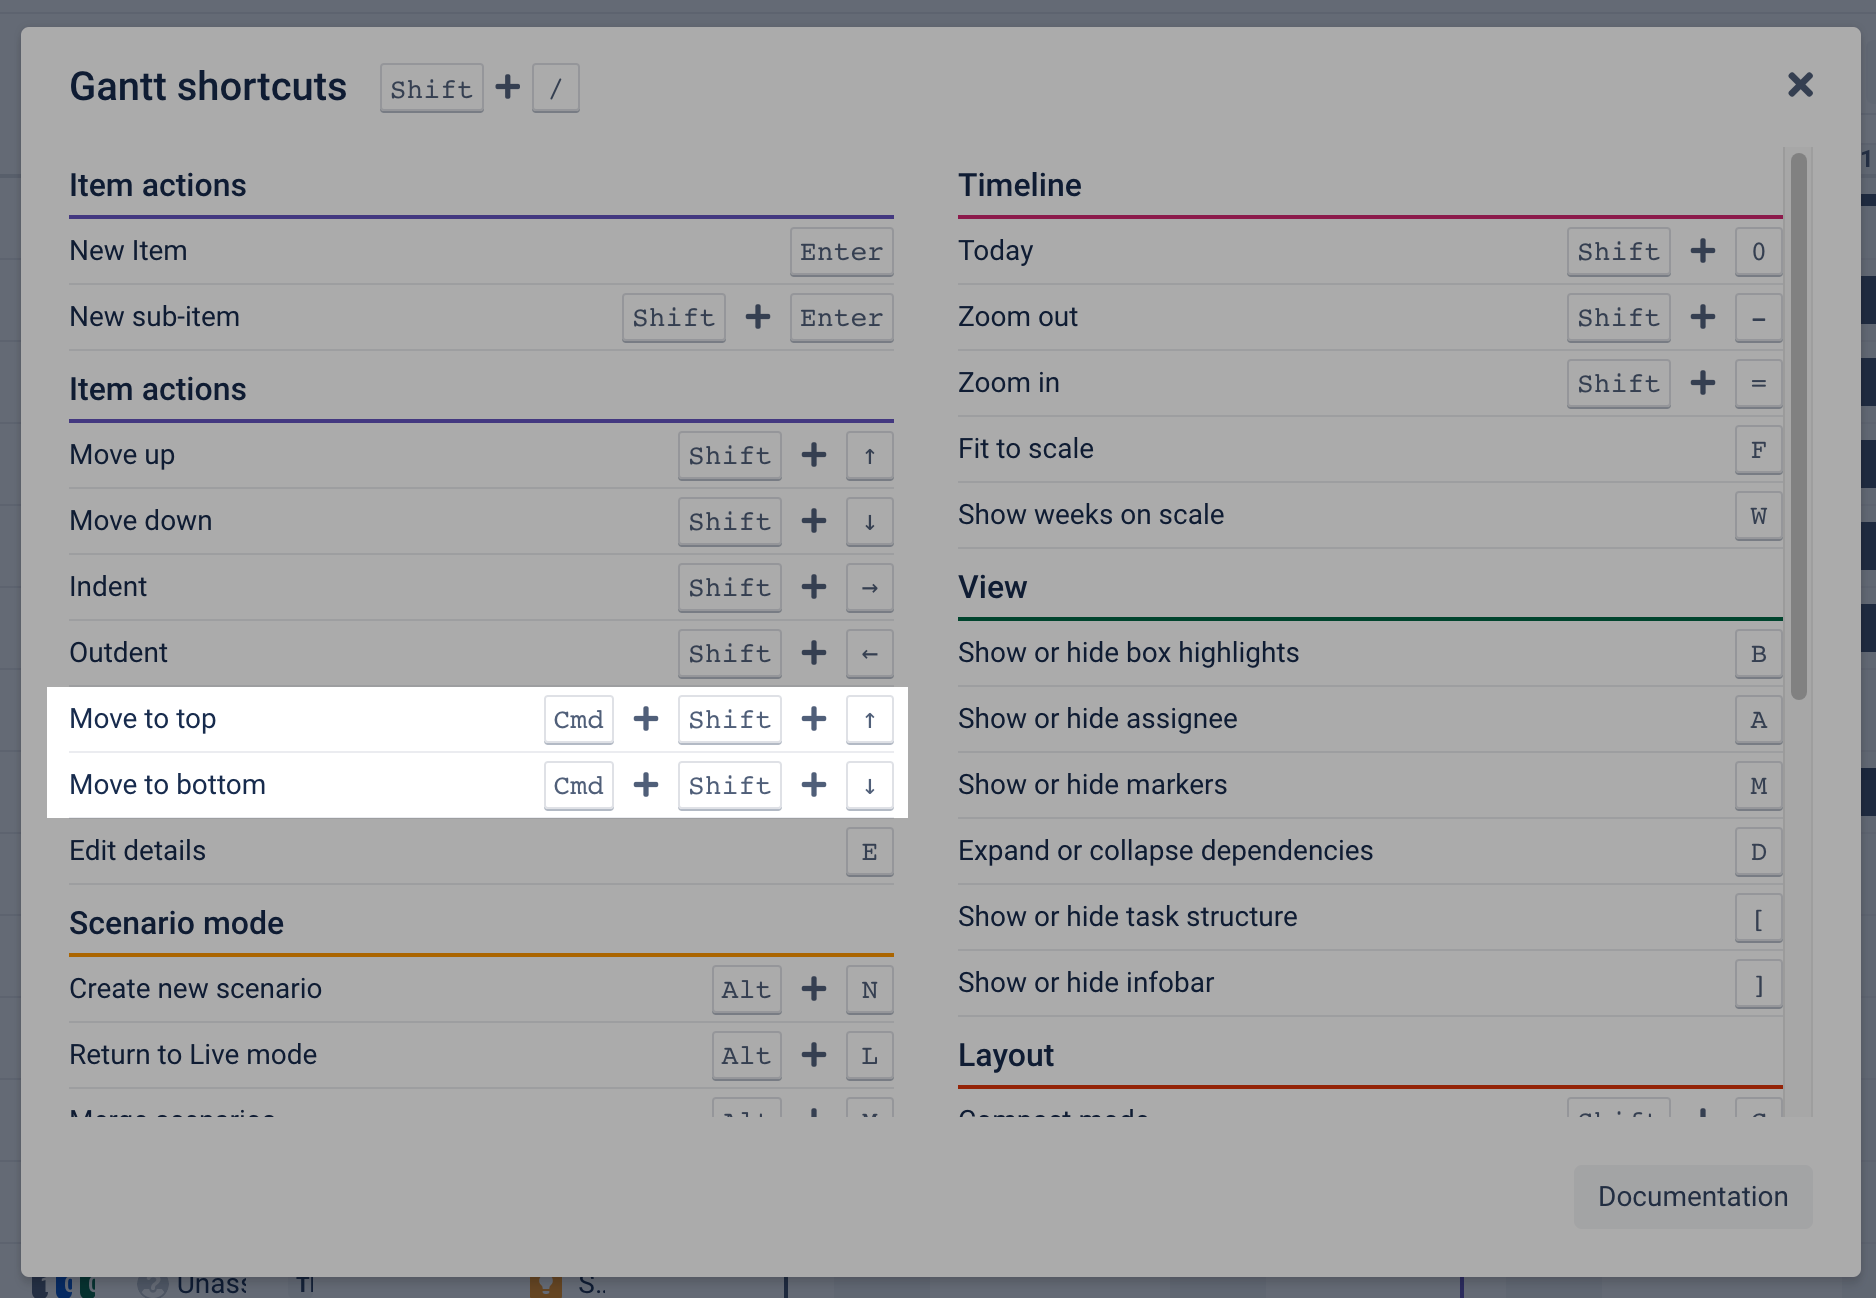
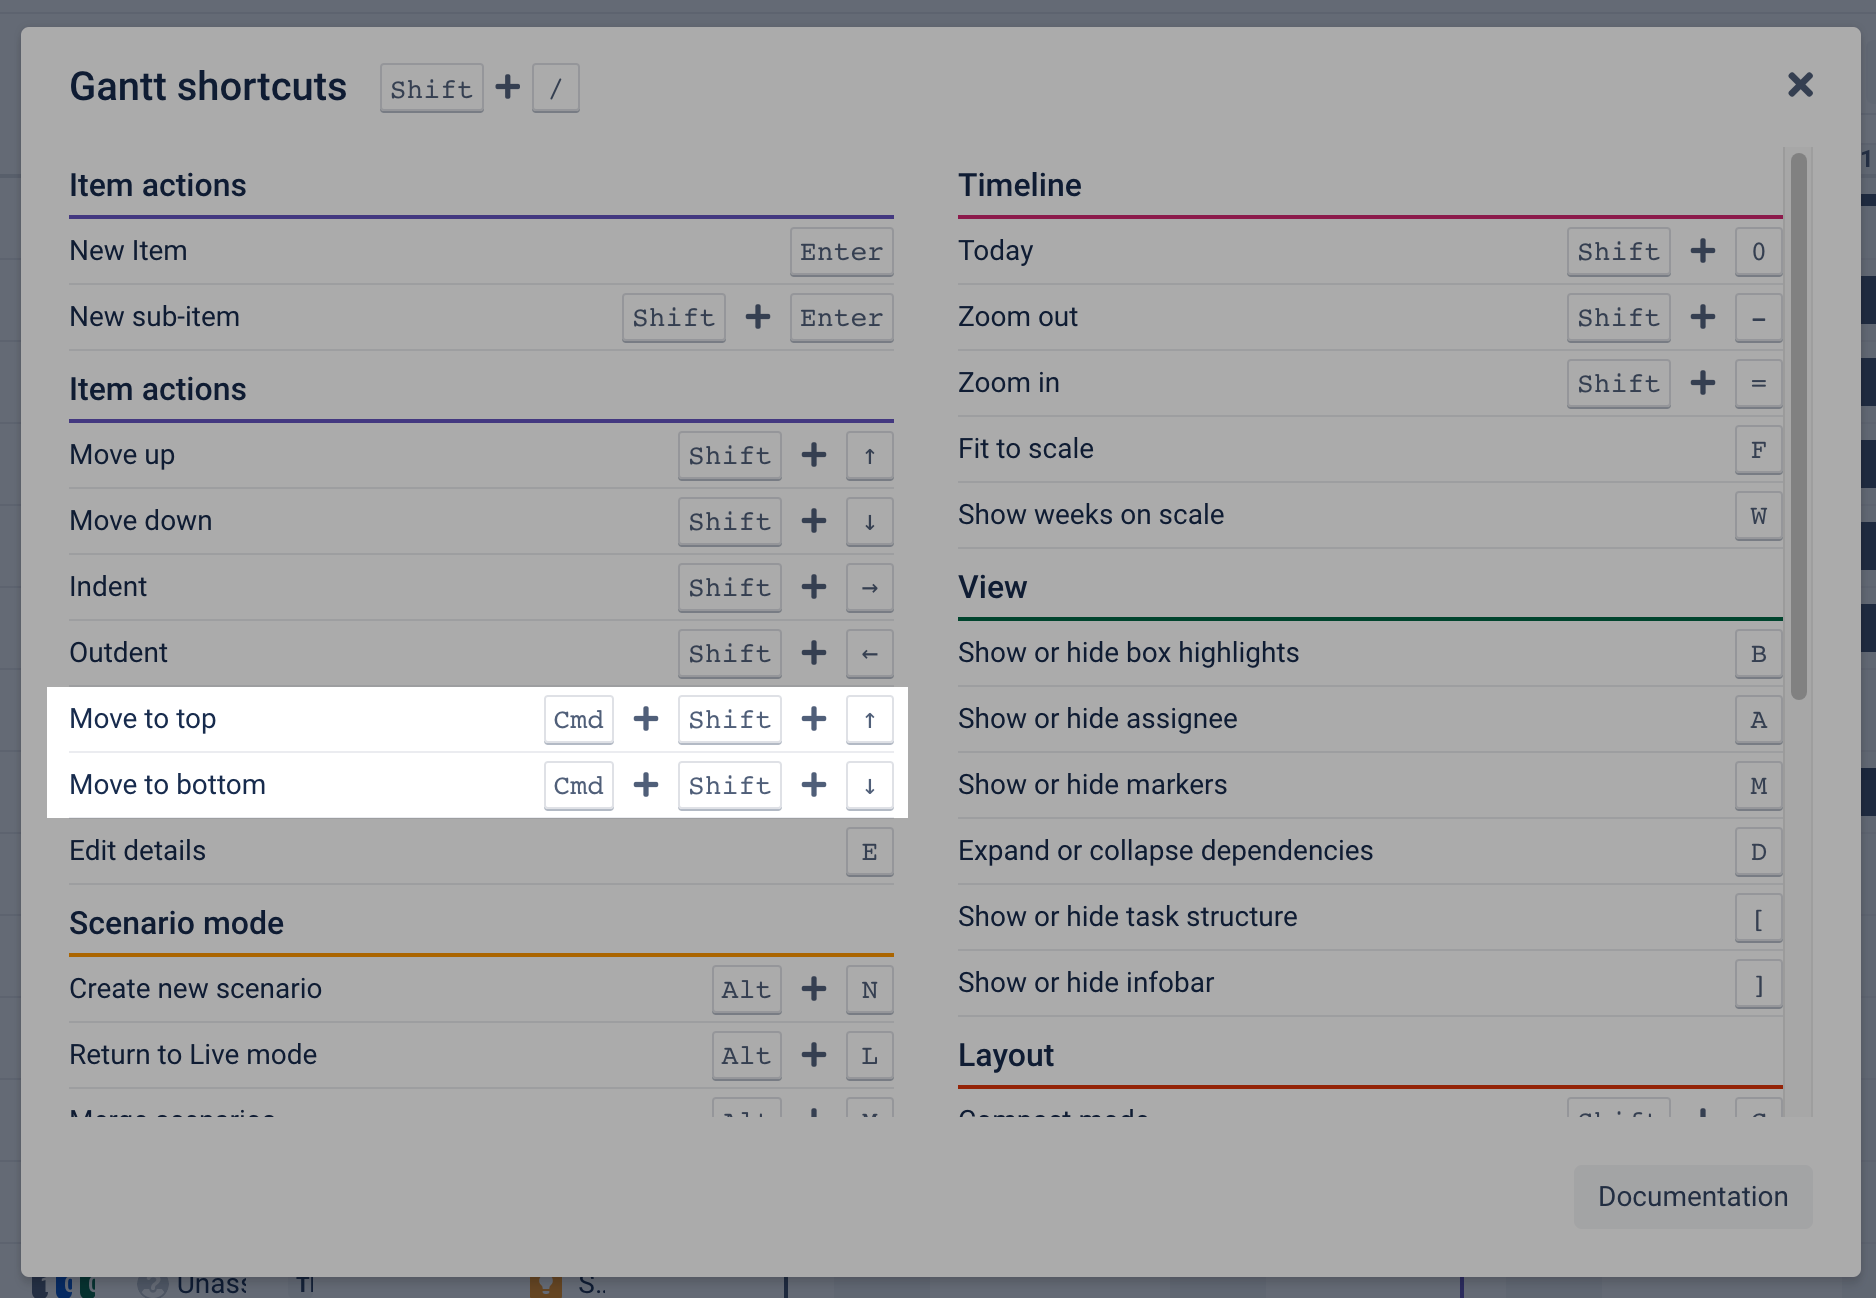
Keyboard shortcuts | Gantt: New keyboard shortcuts Jump between the top and bottom of your chart and likewise move tasks in no time Thanks to the new keyboard shortcuts, you can jump and move tasks to the top (cmd/ctrl+shift+↑) or bottom (cmd/ctrl+shift+↓) of your chart in a blink of an eye. No more “endless” scrolling! |
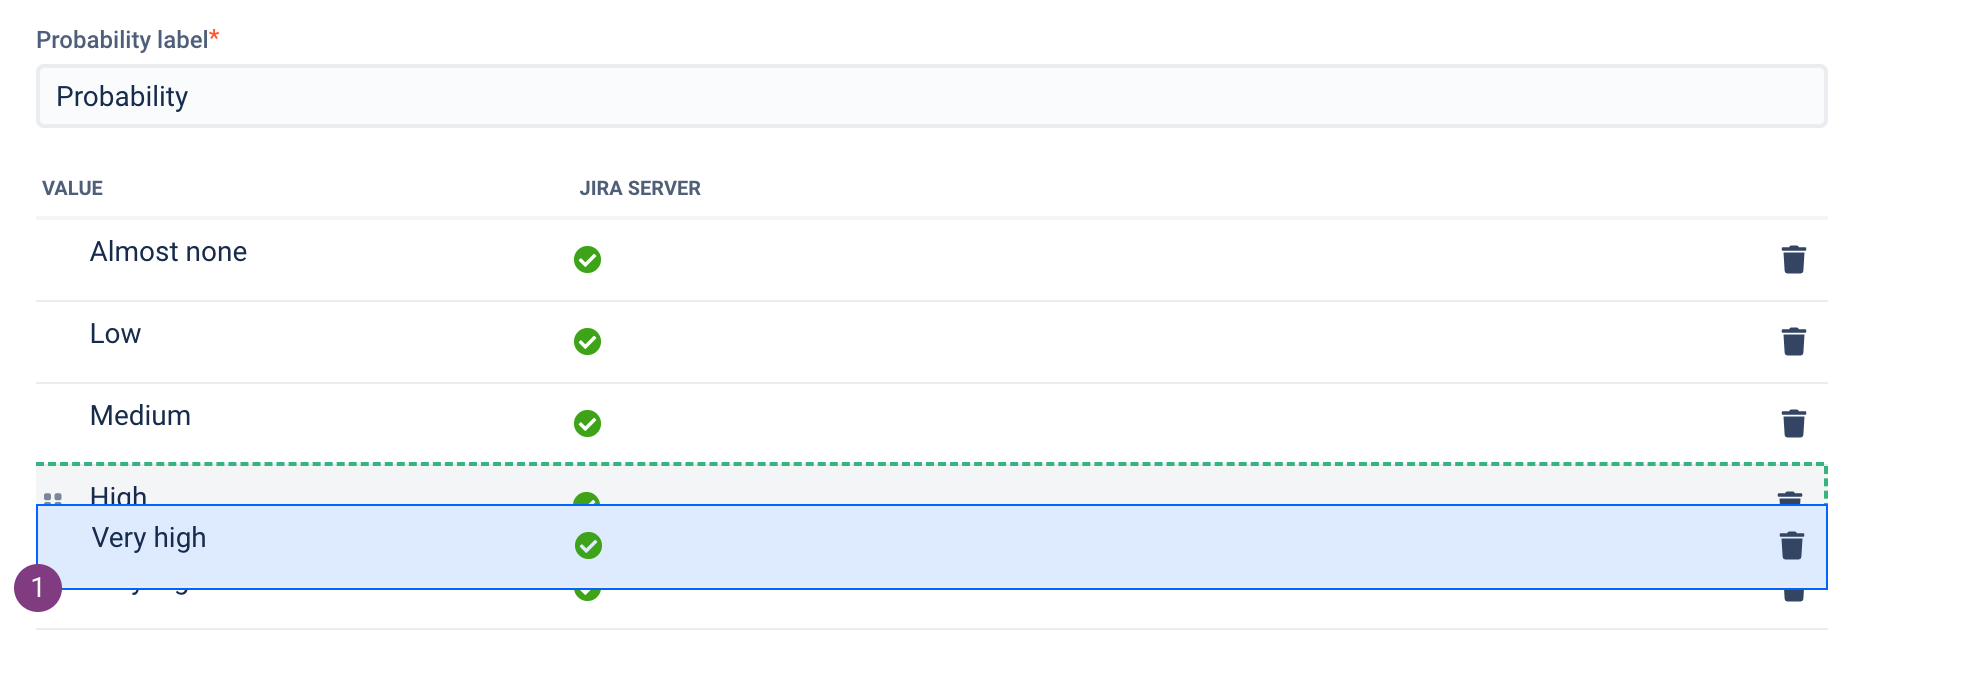
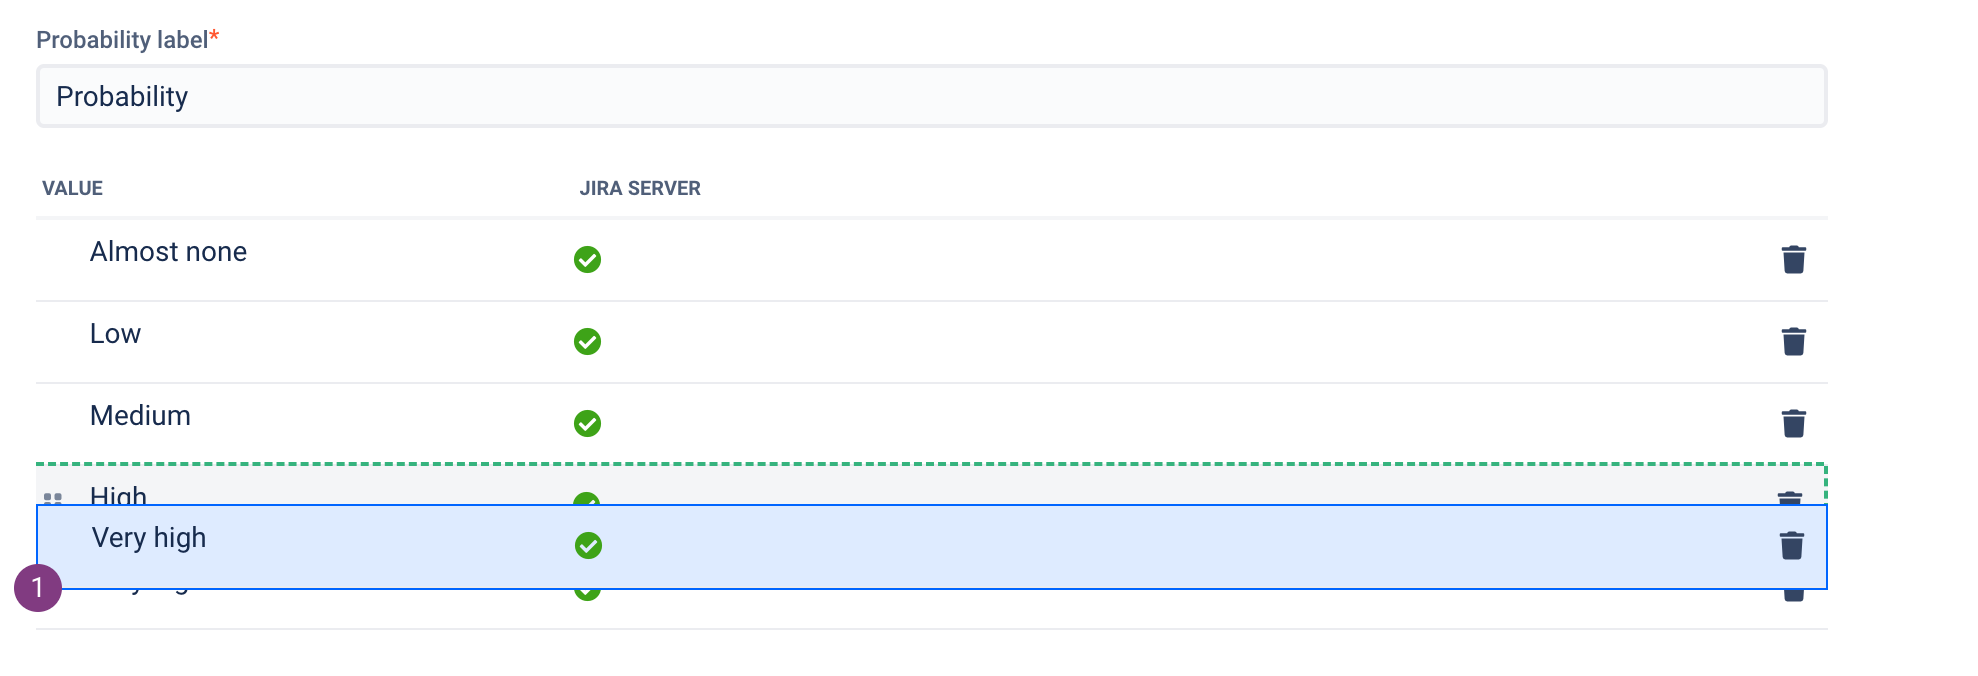
Risks module | Risk probability and risk consequence - drag-and-drop customization of the matrix The order of values for the probability and consequence fields can be changed using the drag and drop mechanism. |
Change log - saving risk settings Changes made to the probability and consequences fields' position are listed in a change log and can be reviewed before the new configuration is saved. | |
Warning - task could not be moved When a risk field hasn't been configured |
in Risks Administration, you can't use the drag-and-drop mechanism to move a risk. Contact your Jira admin regarding the configuration.
| |
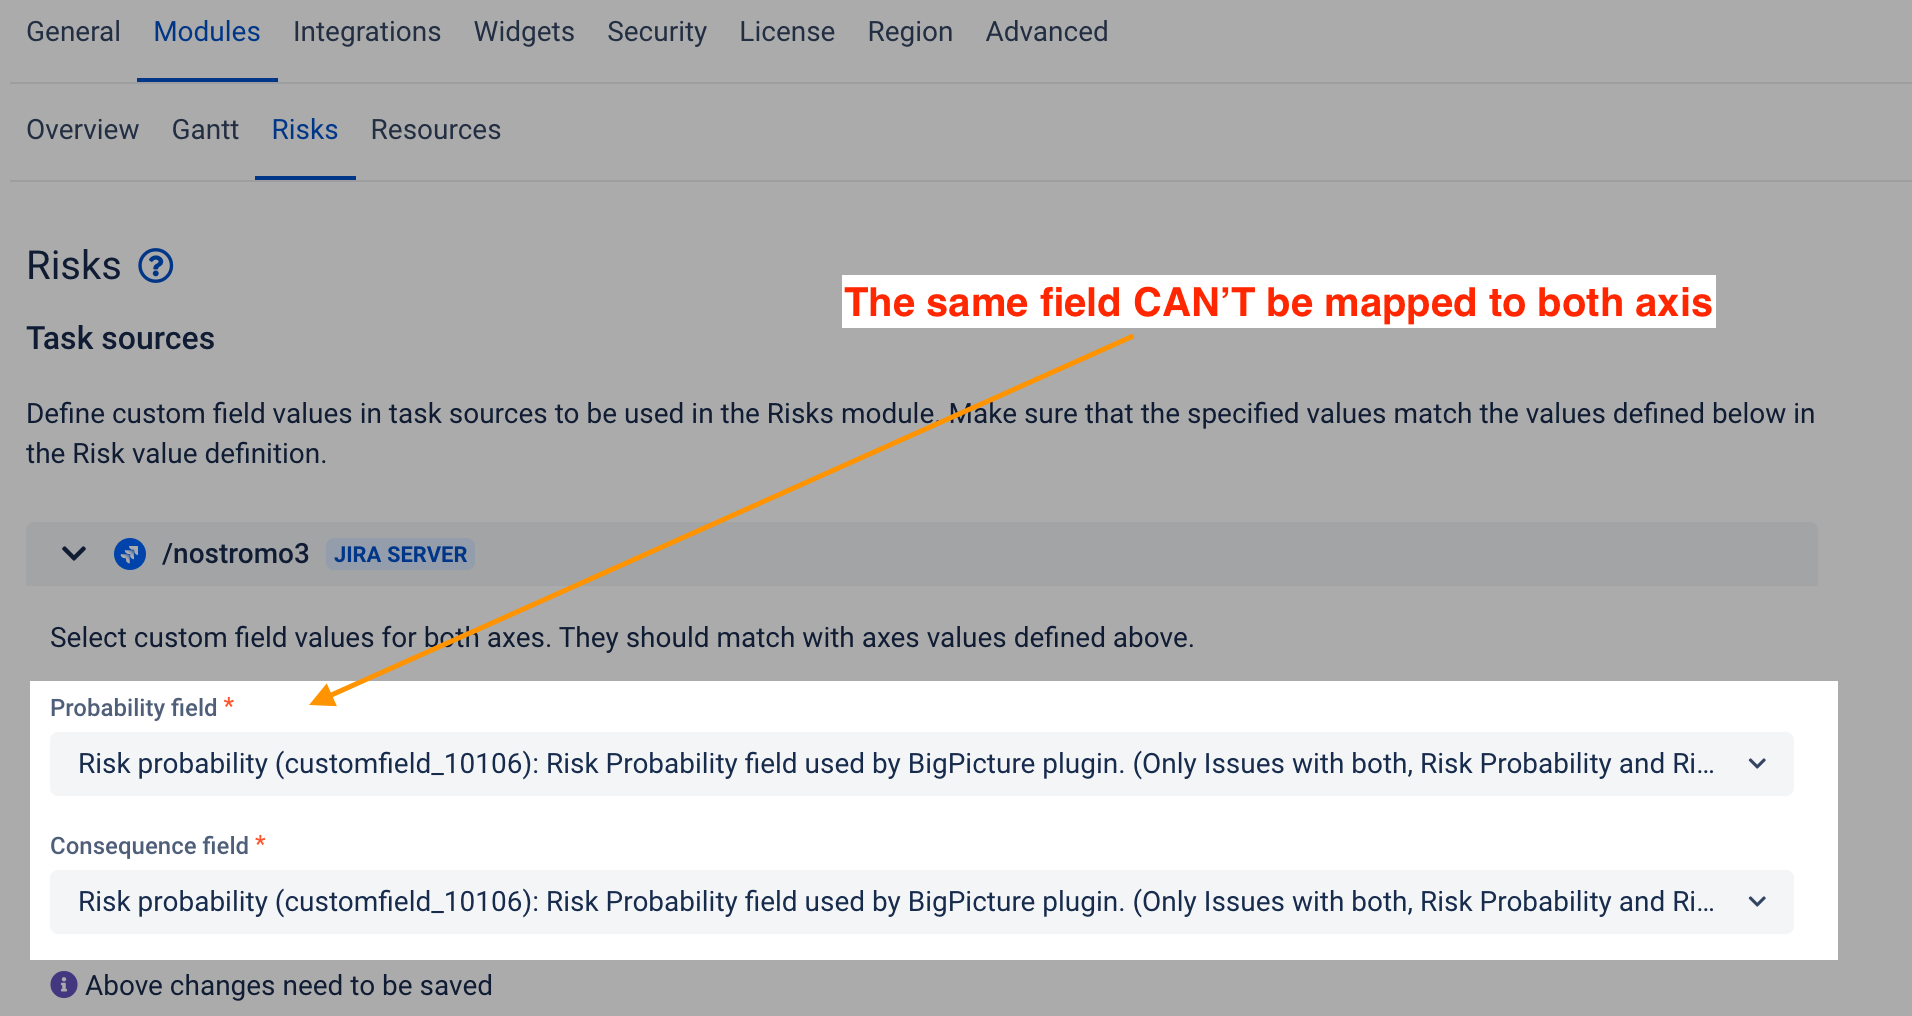
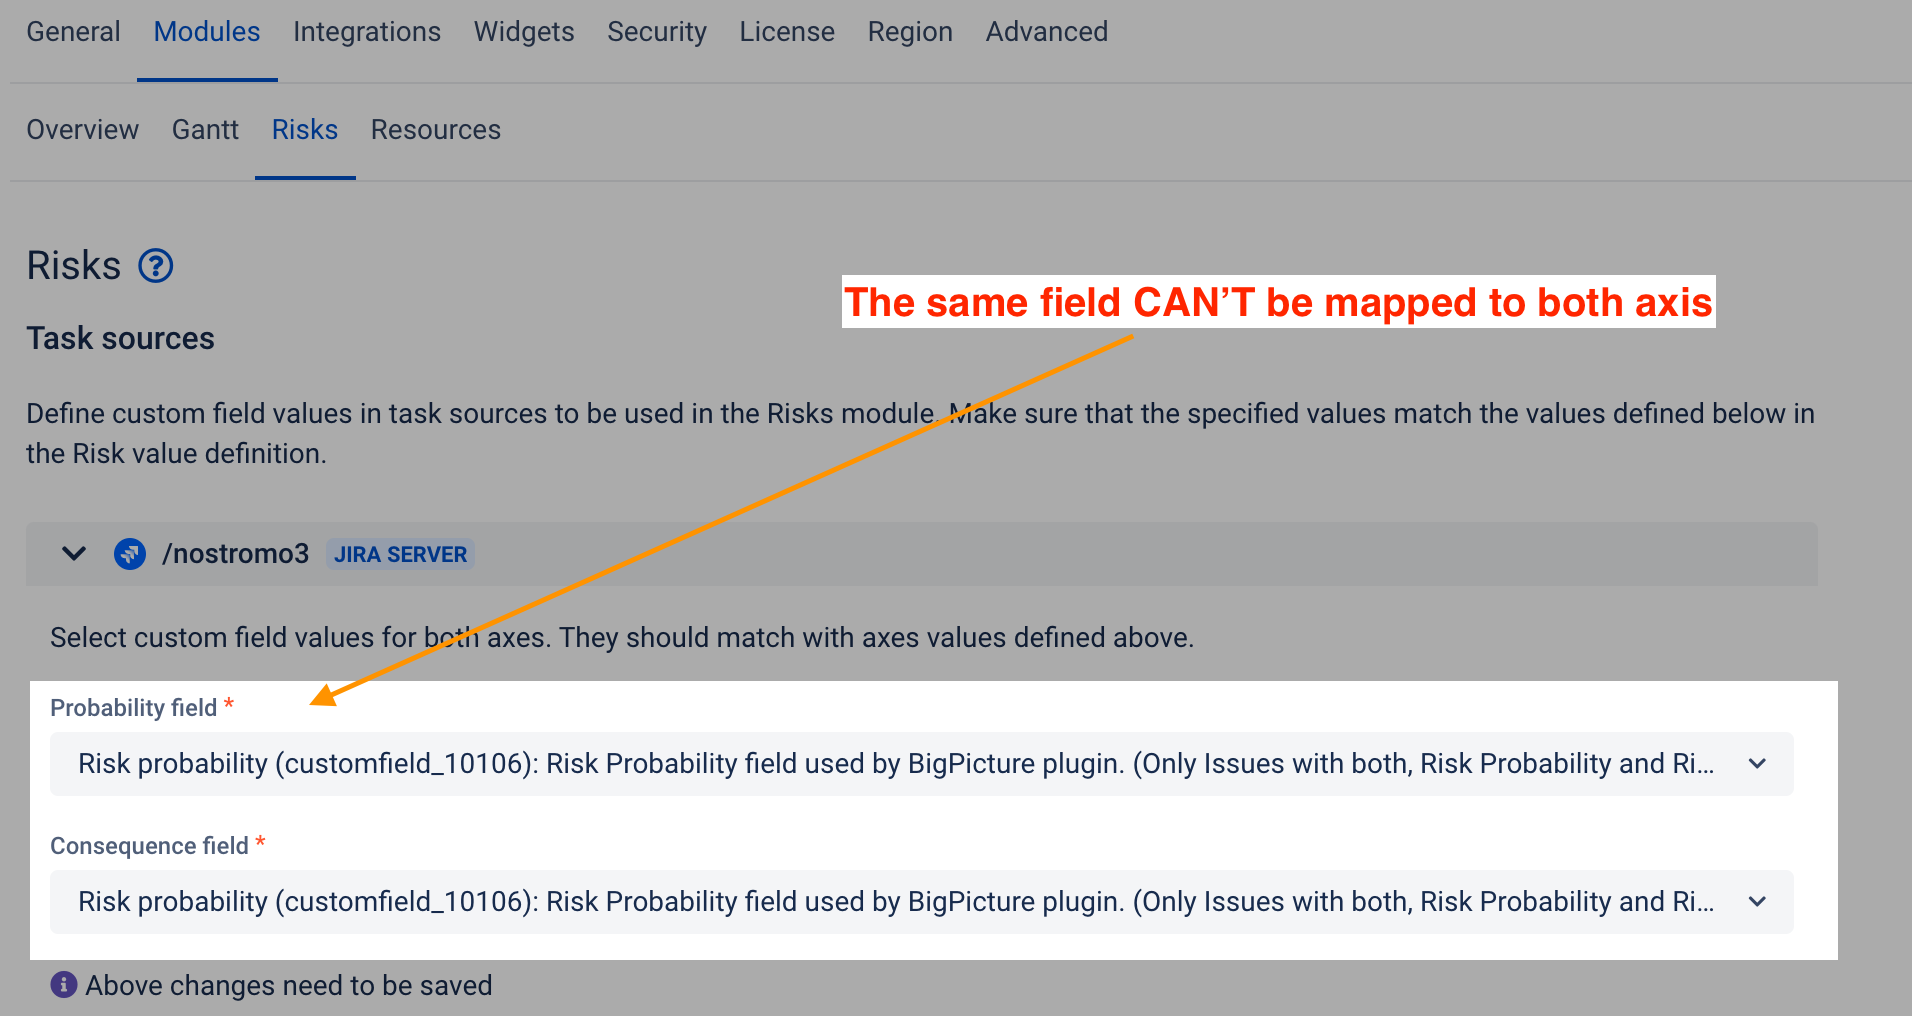
Probability and Consequence axis - the same field cannot be mapped to both axis |
Resources module | User can't edit task - reason displayed
|
