...
| Info |
|---|
Rich Filters::Service Management Dashboards is an extension of of the Rich Filters for Jira for Jira Dashboards app. This extension adds functionality specific to Jira Service Management on top of to the existing rich filters. If you are not already familiar with the rich filters, you should first have a look at the Please check the Rich Filters for Jira Dashboards documentation before you proceed. |
This page describes the functionality provided by the the Rich Filters::Service Management Dashboards app. The app enriches the rich filters and allows the users to build metrics and track SLA Goals for Jira Service Management projects. These features are essential when building dashboards for Service Management teams:
| Table of Contents | ||||
|---|---|---|---|---|
|
| Anchor | ||||
|---|---|---|---|---|
|
...
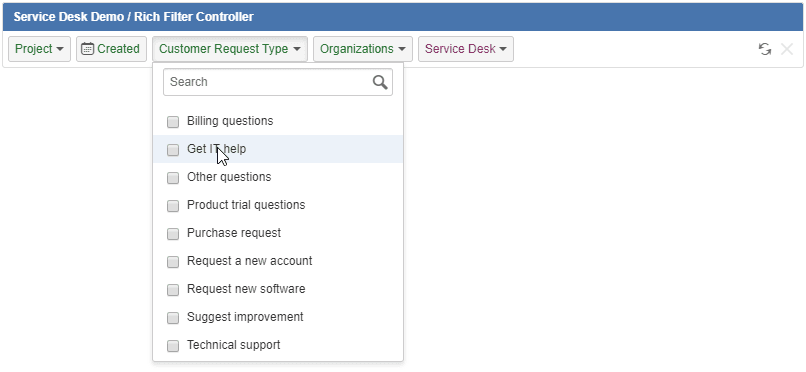
Dynamic filtering and statistics on customer request types and organizations
Dynamic filtering on Jira Service Management specific fields – Customer Request Type and Organizations
which
Users can define dynamic filtersthat work exactly like
allthe other dynamic filters provided by the Rich Filters
for Jirafor Jira Dashboards app. This
way it is possibleallows users to easily focus on particular request types or organizations.
Statistics on Jira Service Management specific fields – Customer Request Type and Organizations
Users can easily visualize metrics and performances per request type or organization.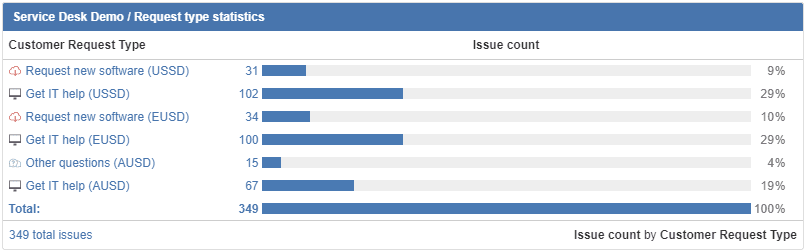
| Anchor | ||||
|---|---|---|---|---|
|
...
Statistics, Charts, and Metrics Based on Service Management SLA Values
The following rich filter gadgets provide new functionality specific to Service Management as described below:
The Rich Filter Statistic Gadget –
display SLAdisplays SLA Completed,
Met,
Breached,
%Met,
%Breached,
and Average
valuesvalues.
Users can monitor values for one or multiple SLA fields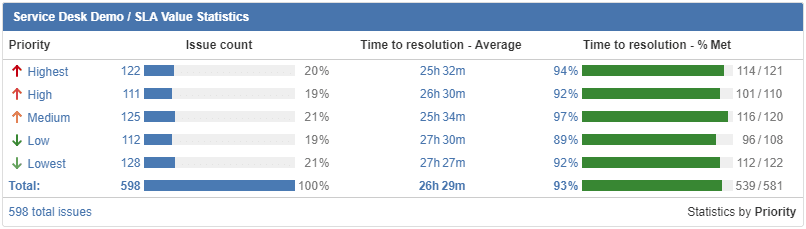

The Rich Filter Two Dimensional Statistics Gadget – display SLA Completed, Met, Breached, %Met, %Breached, Average values
Users can see in detail SLA values displayed for issues grouped on two axes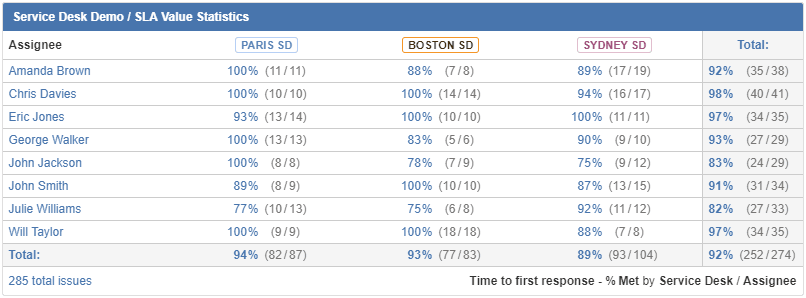

The Rich Filter Simple Counter Gadget –
displaydisplays SLA Completed, Met, Breached,
and Average values
Users can monitor values for one or multiple SLA fields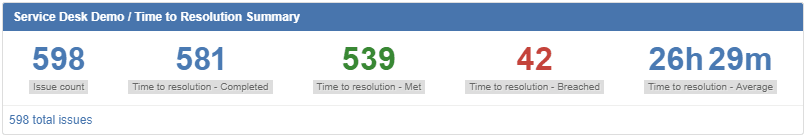

The Rich Filter Simple Gauge Gadget –
display SLAdisplays SLA %Met and %Breached values
Users can monitor SLA Met and Breached ratios for one or multiple SLA fields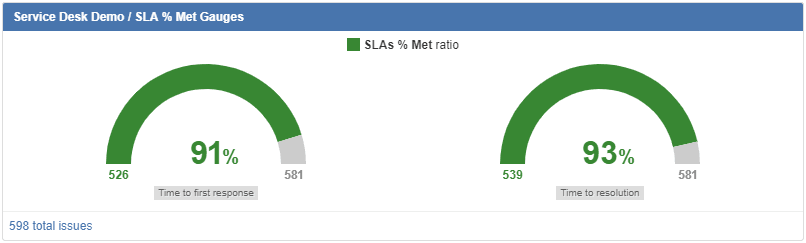

The Rich Filter Smart Counters Gadget – display SLA Completed, Met, Breached, Average values
Users can monitor SLA values split by user-defined criteria (for example, by Service Desk)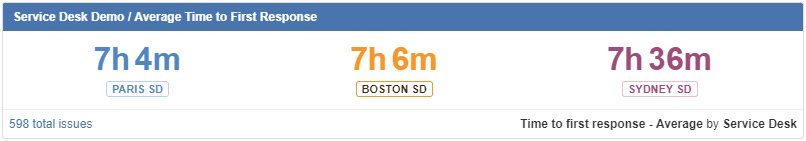
The Rich Filter Smart Gauges Gadget –
display SLAdisplays SLA %Met and %Breached values.
Users can monitor SLA Met and Breached ratios split by user-defined criteria (for example, by Service Desk)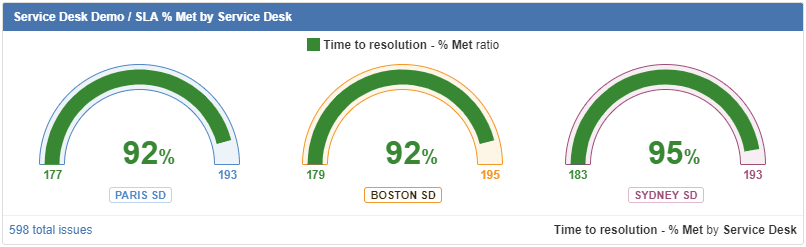
| Anchor | ||||
|---|---|---|---|---|
|
...
Statistics on
...
service management SLA completion dates
The following rich filter gadgets provide new functionality specific to Service Management as described below:
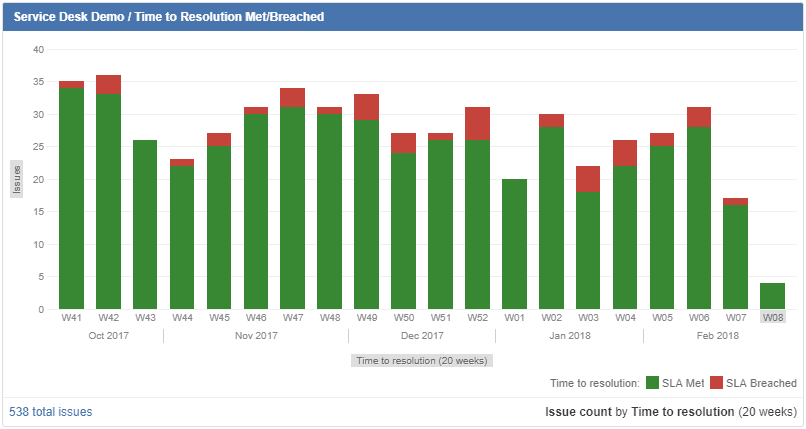
The Rich Filter Date Bar Chart Gadget –
displaydisplays any SLA Met/Breached ratio based on the SLA completion date
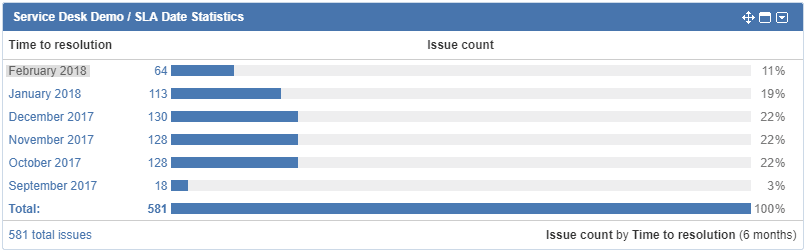
The Rich Filter Statistic Gadget –
displaydisplays SLA values based on the completion date of any SLA
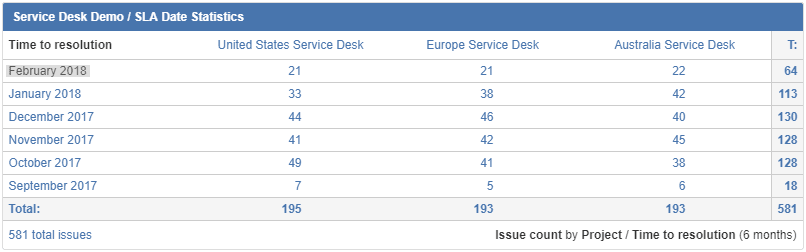
The Rich Filter Two Dimensional Statistics Gadget –
displaydisplays SLA values based on the completion date of any SLA
| Anchor | ||||
|---|---|---|---|---|
|
...
series based on service management SLA values
The following rich filter gadgets provide new functionality specific to Service Management as described below:
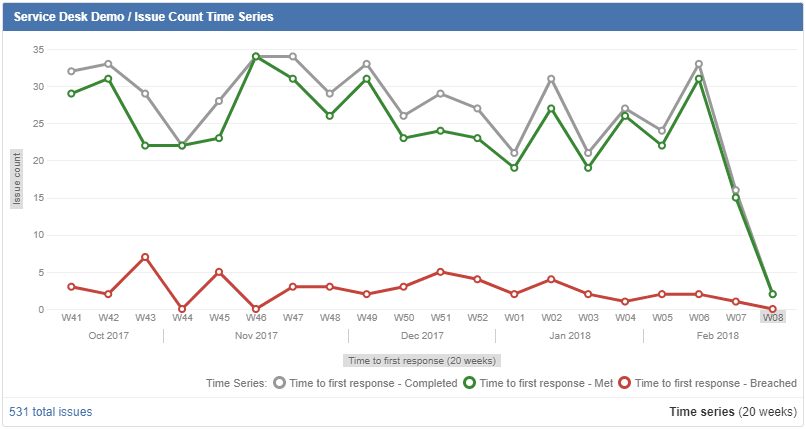
The Rich Filter Time Series Chart Gadget –
displaydisplays SLA time series as line charts
in orderto see trends based on SLA values: Completed, Met, Breached, %Met, %Breached, or Average
in order
Users can easily spot trends and correlationsto understand the performances of their Service Management projects.
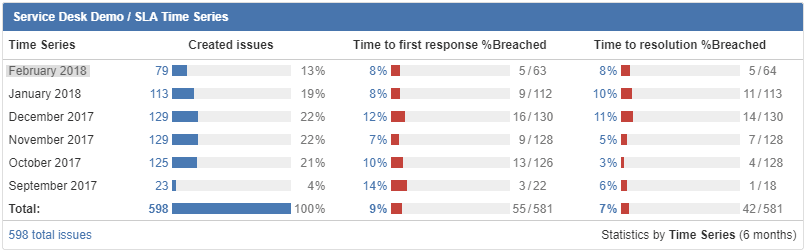
The Rich Filter Statistics Gadget –
displaydisplays SLA time series as tables
in orderto see trends based on SLA values: Completed, Met, Breached, %Met, %Breached, or Average
in order
Users can easily spot trends and correlationsto understand the performances of their Service Management projects.
| Anchor | ||||
|---|---|---|---|---|
|
...
Support for enhanced
...
satisfaction statistics and display of
...
satisfaction date
...
and comment
The Satisfaction field can be used as a numeric field in rich filters and rich filter gadgets as a numeric field. More precisely, users can:
- Use Satisfaction as
Use Satisfaction as the value in Rich Filter Simple Counter, Smart Counters, Statistics, and Two Dimensional Statistics gadgets
Display
thethe Satisfaction
averageaverage, min, or max in the total row of Rich Filter Results gadgets
- Use Satisfaction
Use Satisfaction in custom values and time series
Satisfaction The satisfaction date and Satisfaction the satisfaction comment can be added , as special columns , in rich filter views.