Skip to end of banner
Go to start of banner

_Using Prometheus Exporter for Confluence

Skip to end of metadata
Go to start of metadata

You are viewing an old version of this page. View the current version.

Compare with Current View Page History

« Previous Version 2 Next »

Prometheus Exporter for Confluence enables to expose Confluence metrics: JVM and application statistics to Prometheus.

The app exposes the following metrics:

  • JVM
  • Application statistics
  • Login/logout statistics
  • ...
  • ...


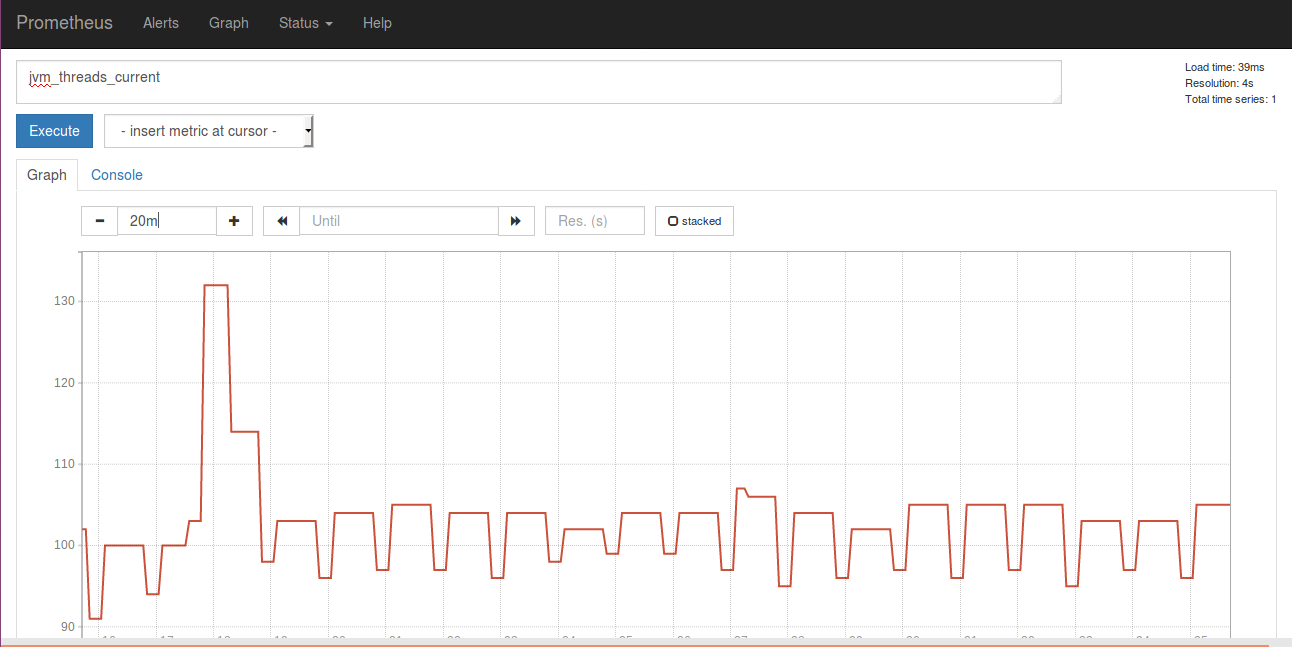
See the following examples for JVM Threads, Memory UsageĀ  andĀ Login Count statistics:

  1. JVM Threads


  2. Memory


  3. Login Count

See also

_Prometheus Exporters - Configuring Prometheus Exporters

  • No labels