...
| Table of Contents | ||
|---|---|---|
|
| Anchor | ||||
|---|---|---|---|---|
|
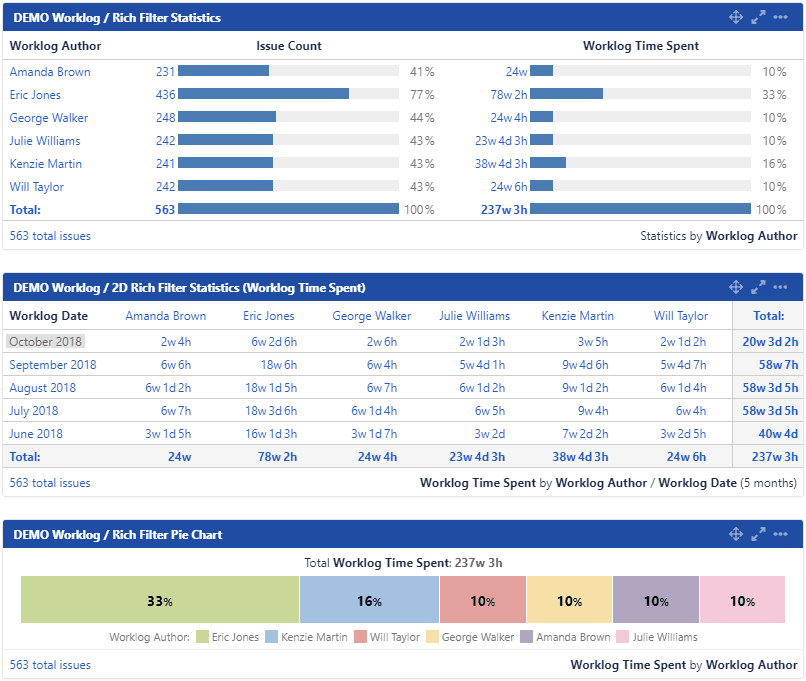
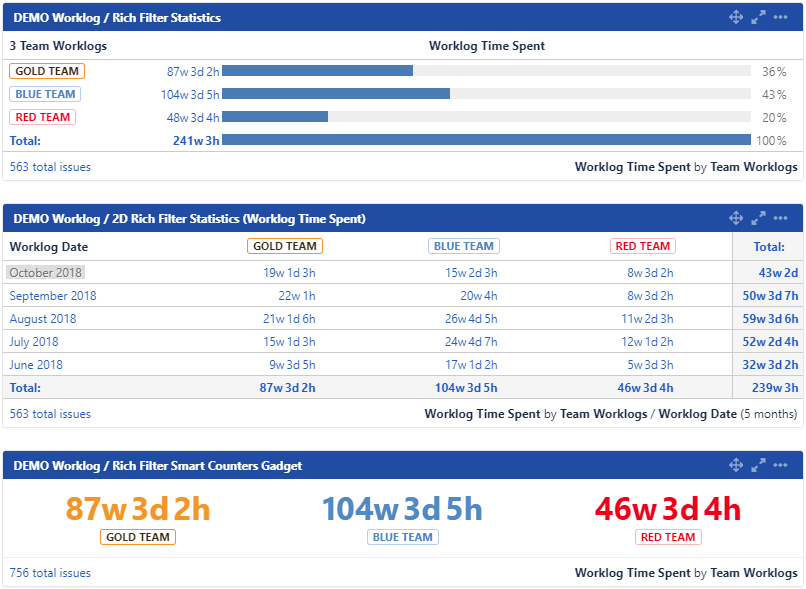
Statistics gadgets can use work log attributes – Worklog Author, Worklog Date – as statistic types and display values based on the time spent at work log level – Worklog Time Spent:
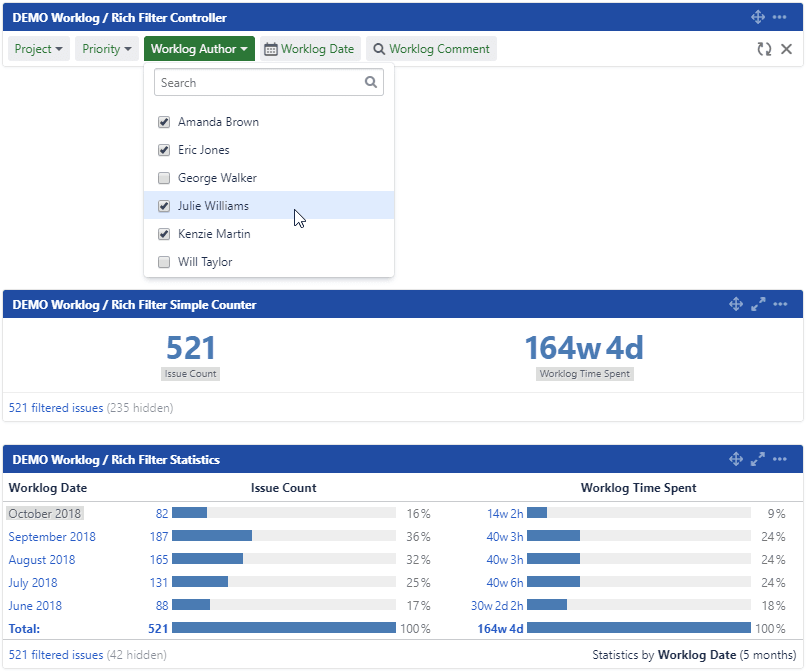
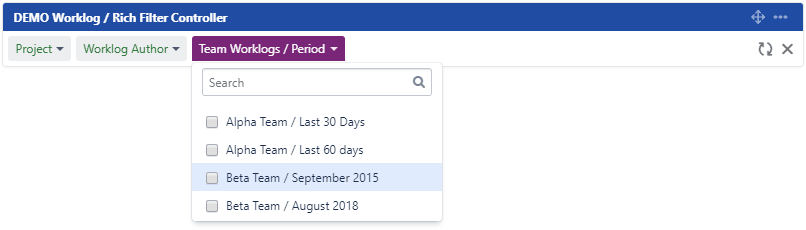
Controllers can dynamically filter on work log attributes – Worklog Author, Worklog Date, Worklog Comment:
| Anchor | ||||
|---|---|---|---|---|
|
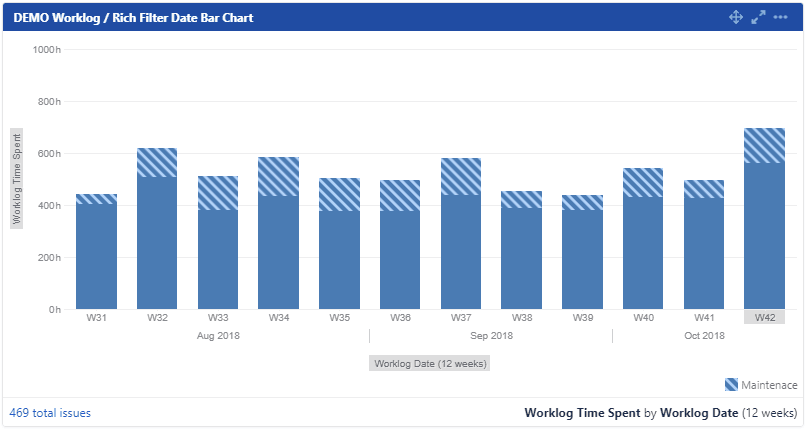
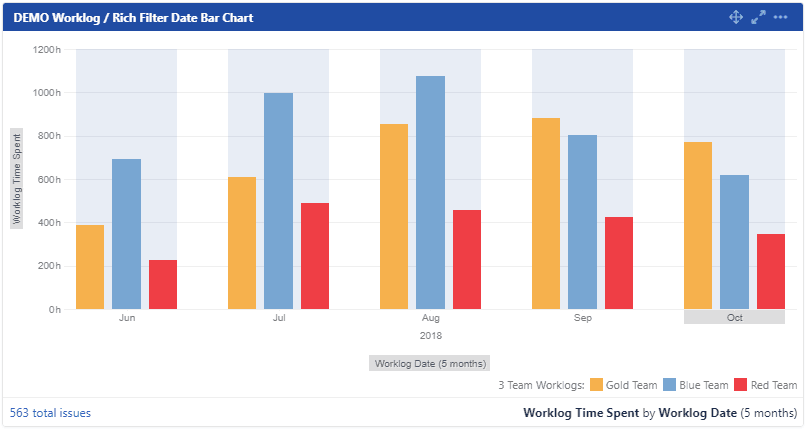
Date Bar Chart gadgets can display the Worklog Time Spent based on the Worklog Date; optionally, JQL filters can be used to split the results:
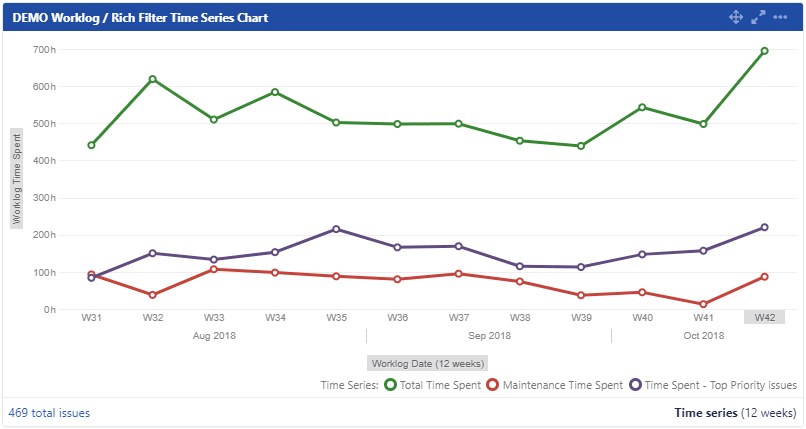
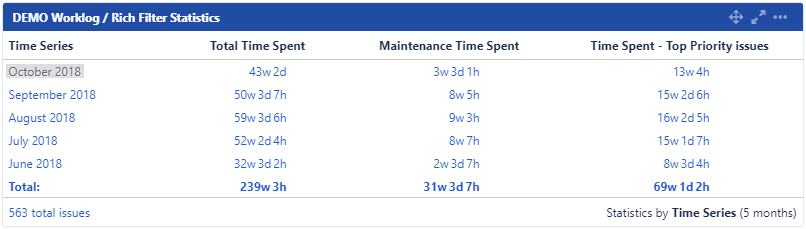
Time series gadgets can display series based on the Worklog Date and Worklog Time Spent. Use JQL sub-filters to easily visualize the time spent for different issue groups
Time series based on Worklog Date and Worklog Time Spent can also be displayed as tables in the Rich Filter Statistics gadget:
| Anchor | ||||
|---|---|---|---|---|
|
Our Worklog Query Language (WQL) can be used to define smart filters at work log level:
Smart filters using WQL can also classify and group work logs in statistics and charts.
Date bar charts can split their data based on static or smart filters using WQL as well:
...