| Auibuttongroup | ||||||||||||||||||||||||||||||||||||||||||||||||||||||||
|---|---|---|---|---|---|---|---|---|---|---|---|---|---|---|---|---|---|---|---|---|---|---|---|---|---|---|---|---|---|---|---|---|---|---|---|---|---|---|---|---|---|---|---|---|---|---|---|---|---|---|---|---|---|---|---|---|
| ||||||||||||||||||||||||||||||||||||||||||||||||||||||||
|
| Panel | ||||||
|---|---|---|---|---|---|---|
| ||||||
This page is about JEP Cloud. Using Jira On-Prem? Click the On-Prem button above. |
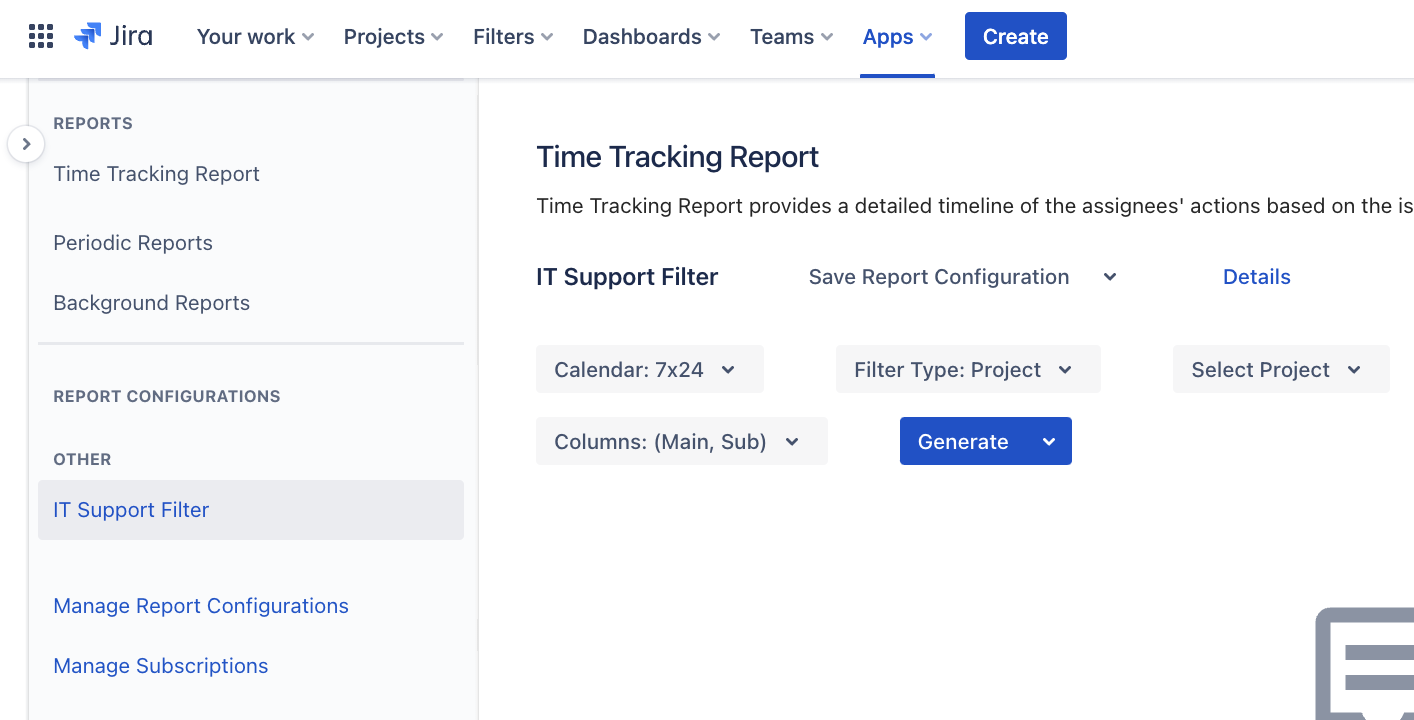
With Enhancer Plugin for Jira Cloud’s Time Tracking Report, you can create a detailed timeline of the assignees' actions based on the issues you define, allowing you to keep track of complex information at a glance. Put simply, this report shows how much time was spent on each issue, which can help you find and fix the bottlenecks in your workflow.
On this page, you can create a new Time Tracking Report in just a few minutes. Let’s take a closer look:
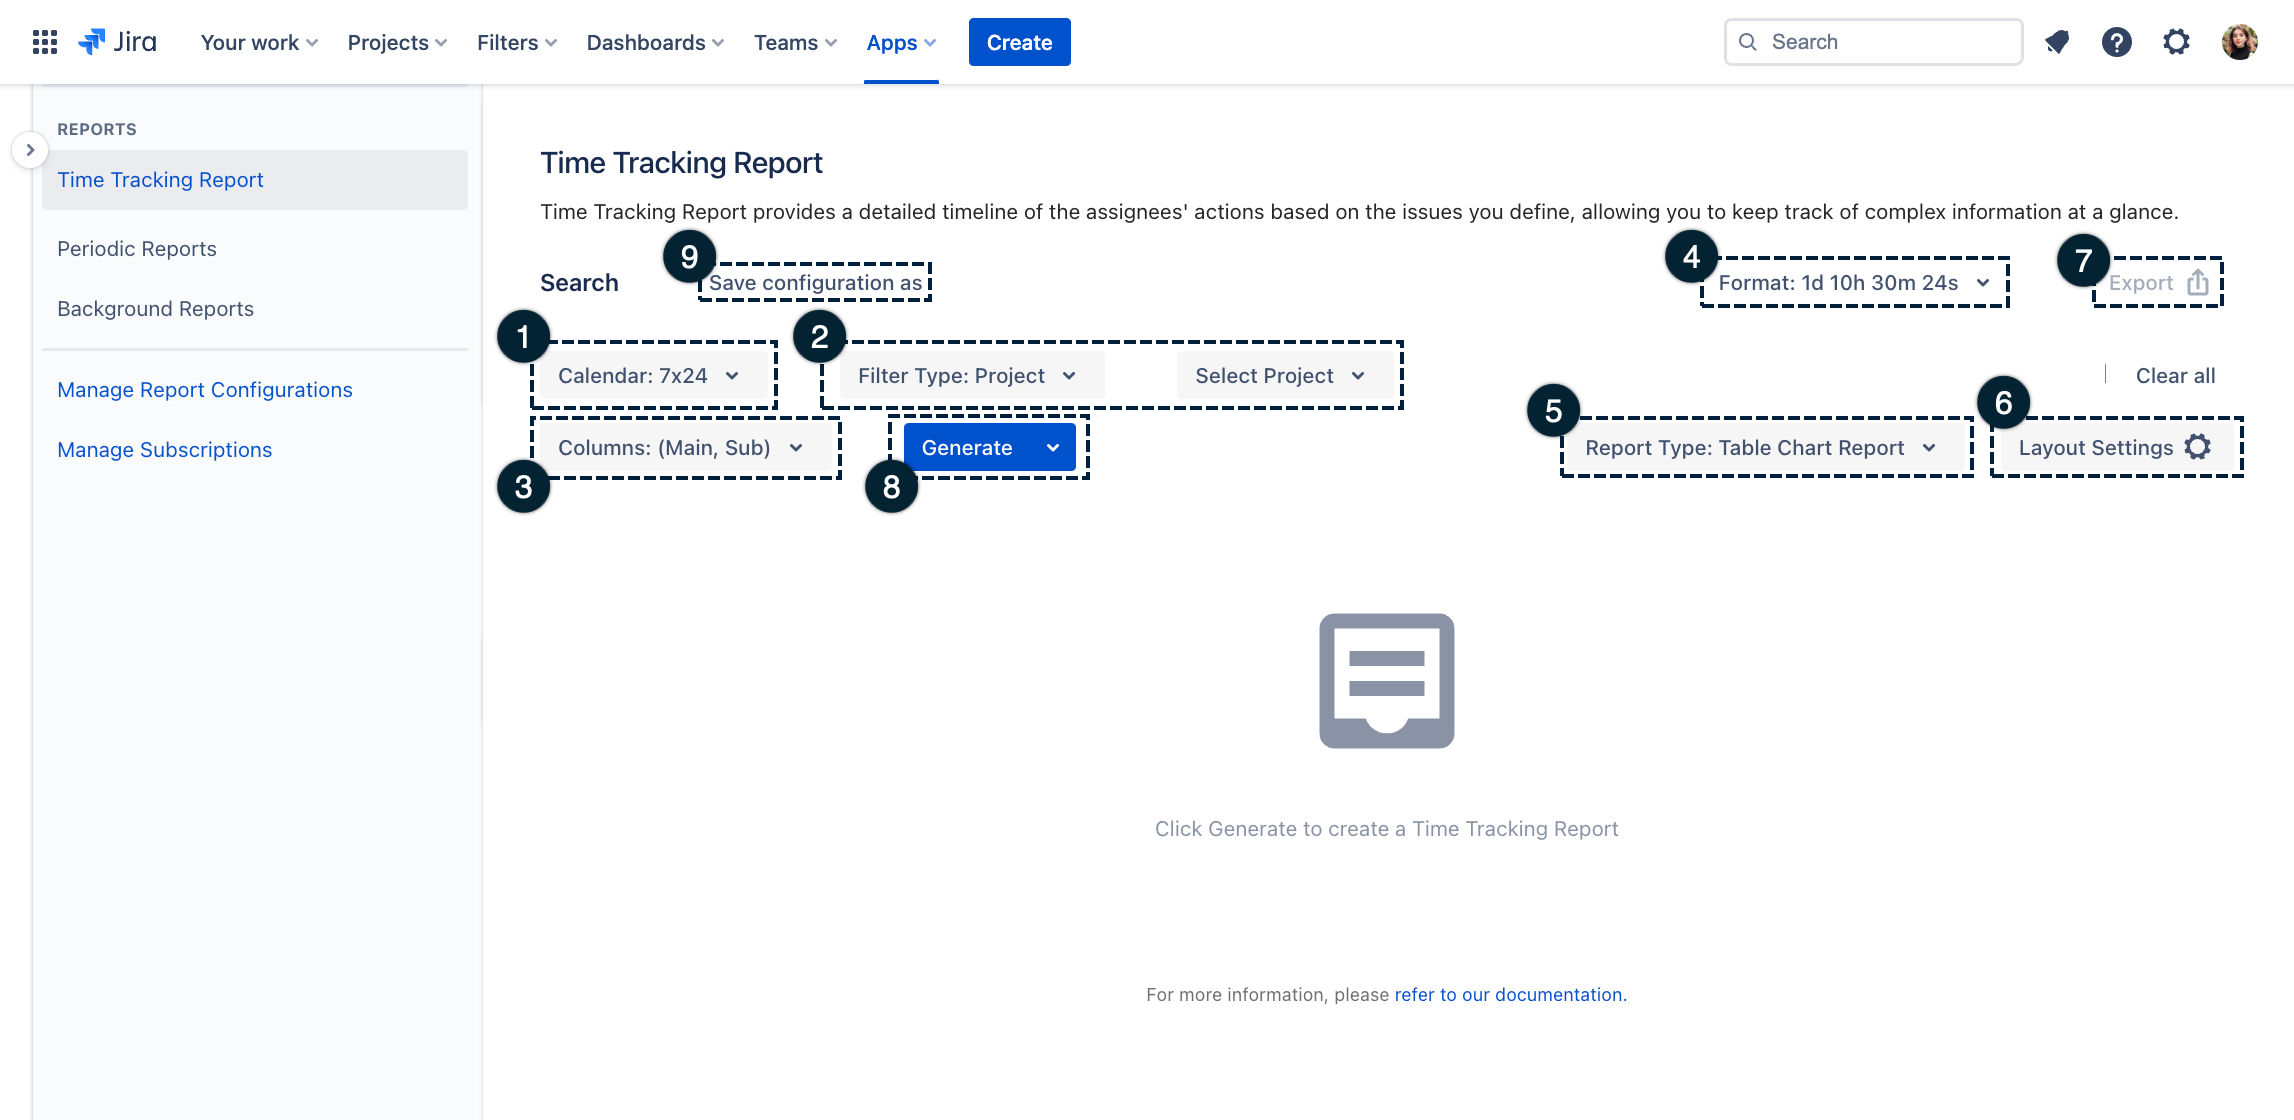
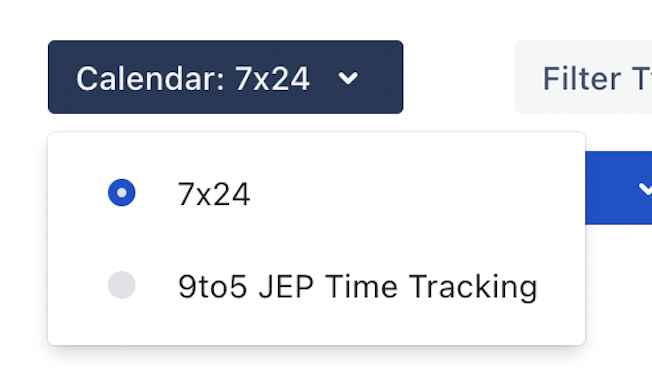
Calendar – Pick the calendar you want to use to prepare the report.
Filter Type – You can filter the report according to Project, Issue Filters, Sprint, or JQL. Play with these to create limitless report types.
Project: Choose which project (issue filter, sprint, or JQL) you want to create the report for.
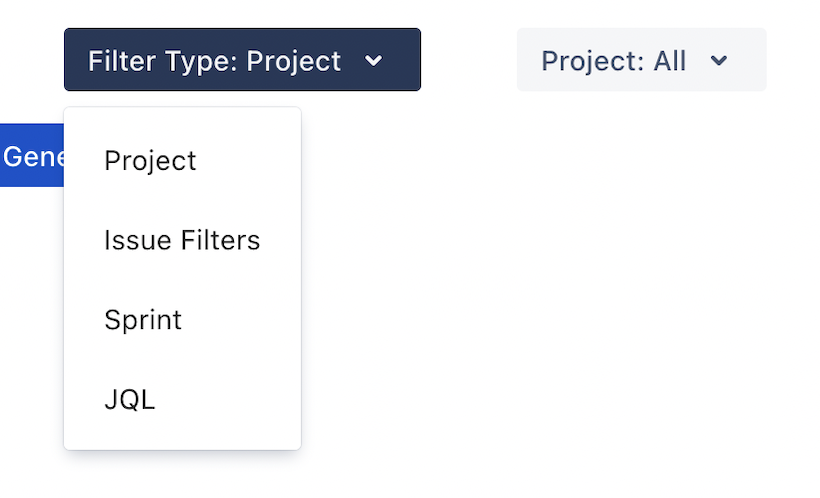
Sprint: If you have an Agile team, you can use this report to see what happens in any specific sprint.
Issue Filters: Use this to define specific Issue Filters (such as All Open Issues or All Resolved Issues).
JQL: For specific use cases and complex requirements, you can use JQL to filter the report.
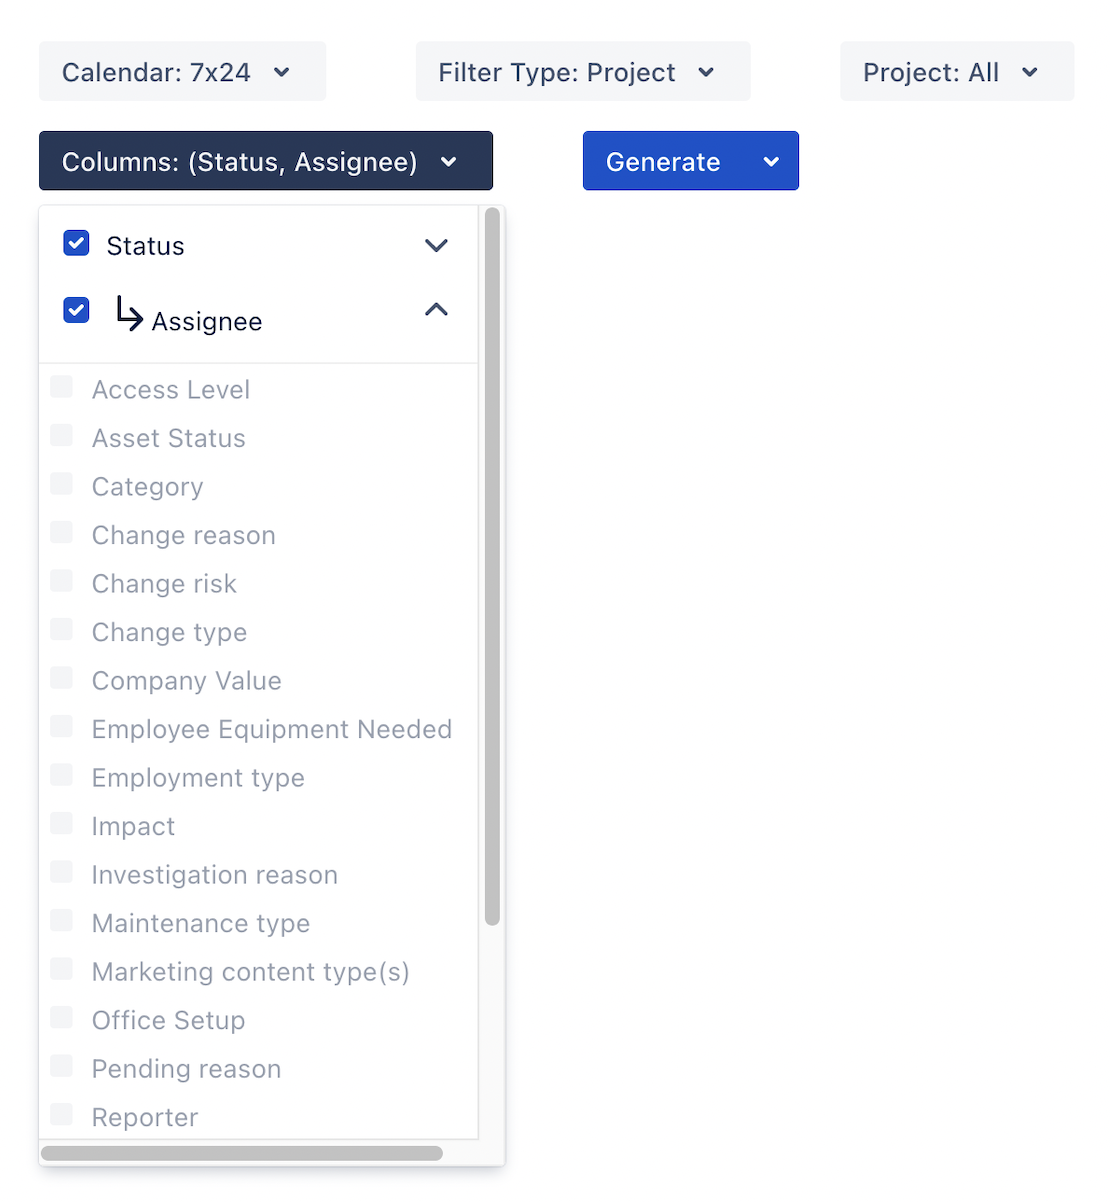
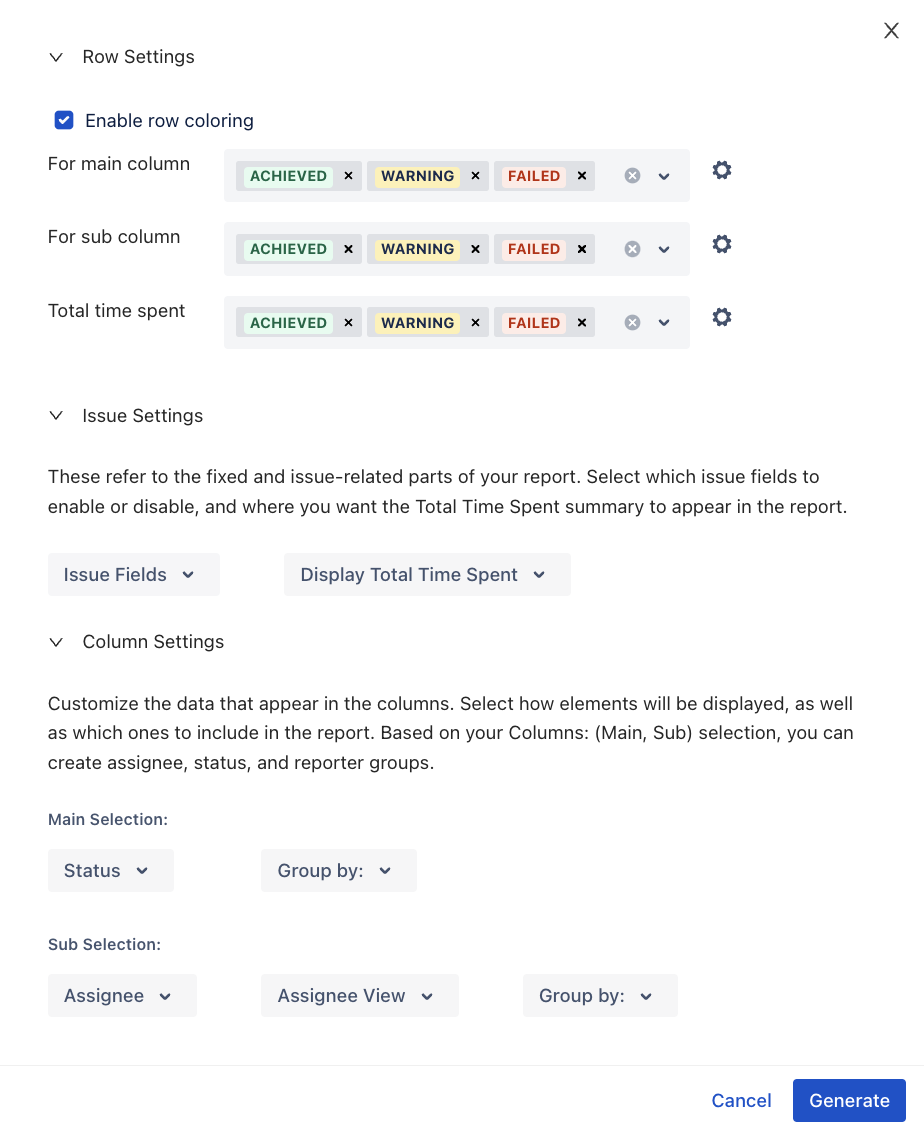
Columns (Main, Sub) – The columns are divided into Main and Sub categories. Here you can display Assignee, Reporter, and Status data, which makes creating multi-dimensional reports a breeze.
Format – Select the Jira time format you want to create the report with.
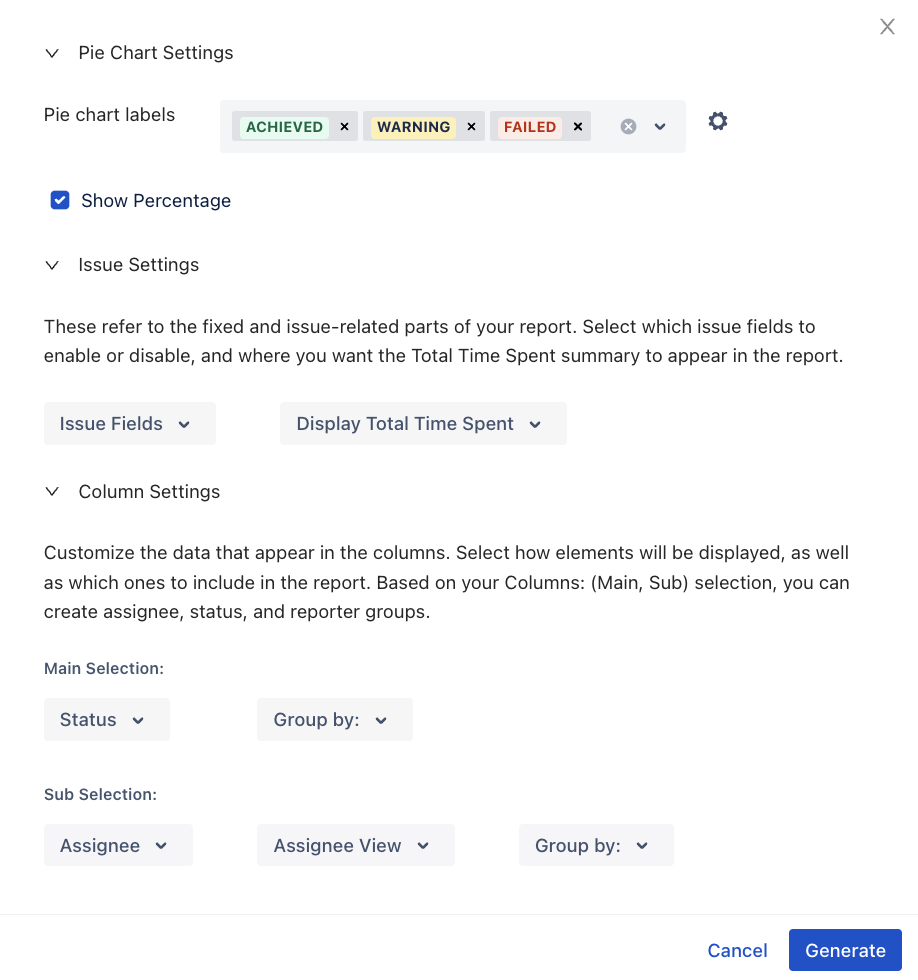
Report Type – There are two types of reports that you can create – Table Chart Report and Pie Chat Report.
Layout Settings – In this section, you can set your preferences for layout changes, groupings, and summaries. You have full control.
Save configuration as – Click to name and save the configuration. You can reuse the same configuration in other reports later. Your report filter will appear on the side panel once saved, under REPORT CONFIGURATIONS.
Export – Click to download your report as an XLSX file.
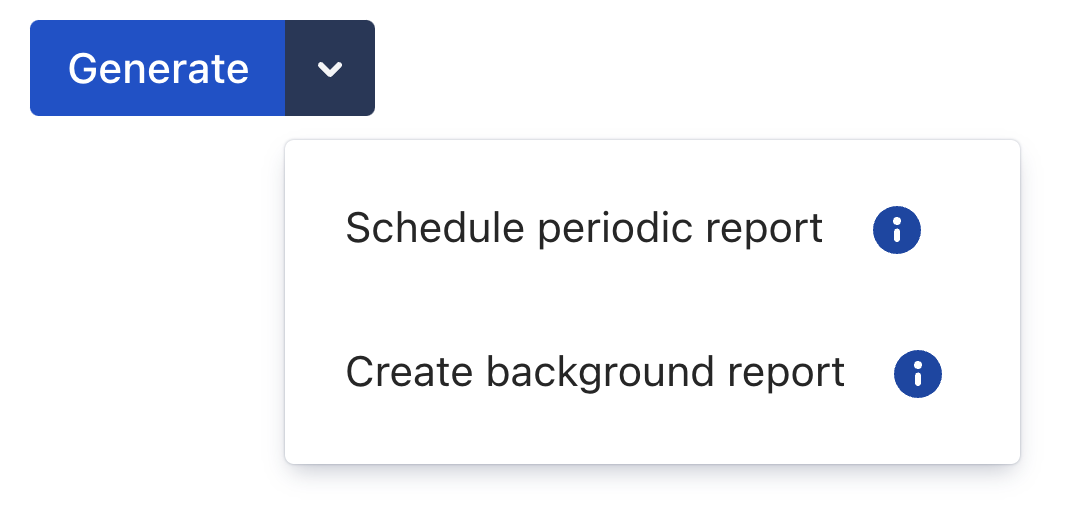
Generate – After finishing your selection, click Generate to create the report. By clicking the dropdown button, you also have the option to Schedule periodic report (Generate your reports to receive them periodically) and Create background report (Generate your reports asynchronously in the background).
🖇️ Related Articles
| Panel | ||
|---|---|---|
| ||