| Table of Contents | ||||
|---|---|---|---|---|
|
| Excerpt | ||
|---|---|---|
| ||
 |
Overview
Cycle time is an important metric in project management. It measures the amount of time it takes for a task to move from the moment the work has started to finish, including any time spent in various stages such as coding, testing, and deployment. Thus, teams gain a clear picture of the efficiency of their processes.
Besides that, it’s helpful for identifying bottlenecks in the workflow that may be causing delays or slowing down the delivery of work.
| Panel | ||||||||
|---|---|---|---|---|---|---|---|---|
| ||||||||
Do you know that you can also measure the Lead Time? Check it out here Lead Time |

Reporting by
In this section you can select what element of work do you want to measure the cycle time: Assignees, Projects, Epics or Filters/Custom JQL:
Assignees. The result will be that of calculating the time of the selected assignees. With this option you can select the issue types you want to exclude from the calculation.
Projects. The result will be that of calculating the time of the selected projects. With this option you can select the issue types you want to exclude from the calculation.
Epics. When reporting by epics, the time of the child issues of the selected epics will be computed, but not that of the epics themselves. With this option you can select the issue types you want to exclude from the calculation.
Filters/Custom JQL. The result will be that of calculating the time of the returned issues by the query.
Statuses included in the Cycle Time
Remember that issues follow a workflow (set of statuses and transitions that an issue moves through during its lifecycle). The cycle time indicates the time spent working on an issue, from the moment the work starts on it (any where the Status Category is In Progress
| Status | ||||
|---|---|---|---|---|
|
| Status | ||||
|---|---|---|---|---|
|
Goal
Adding a goal to the cycle time gadget provides several advantages such as a baseline to improve efficiency in your processes, encourage teams to work better together and increase transparency and accountability.
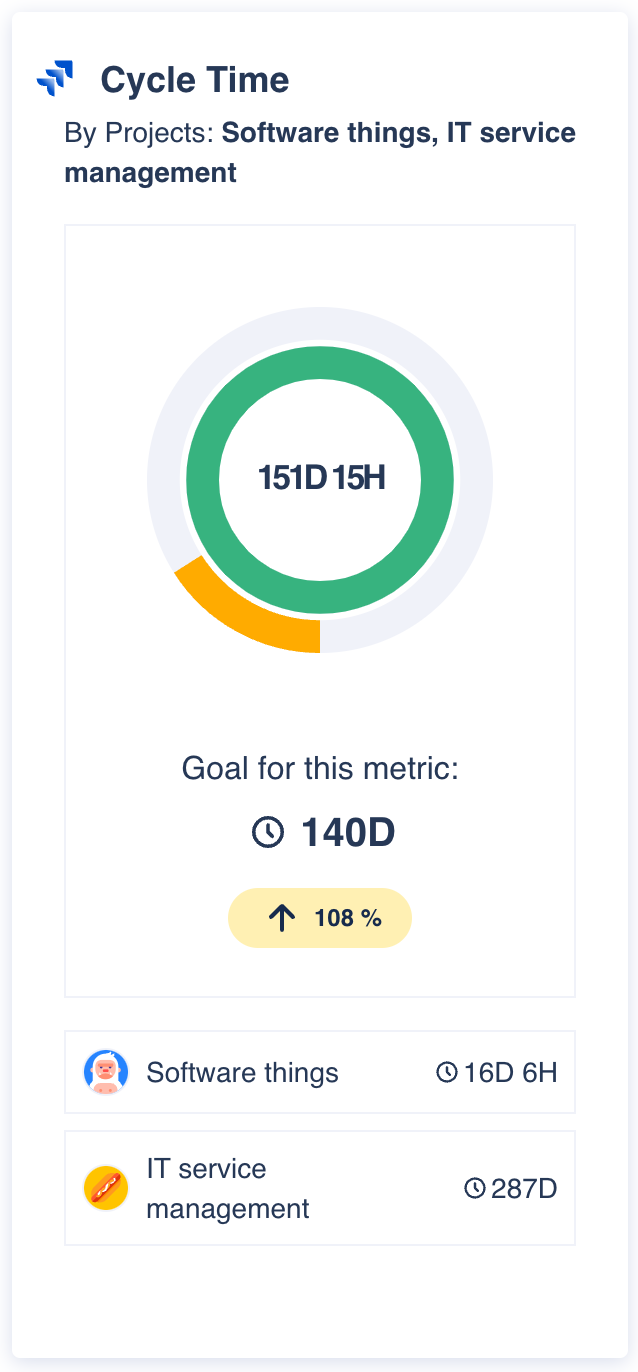
You can set a time to beat as your metric goal. If you're doing better or worse, we'll notify you with a visual indicator:
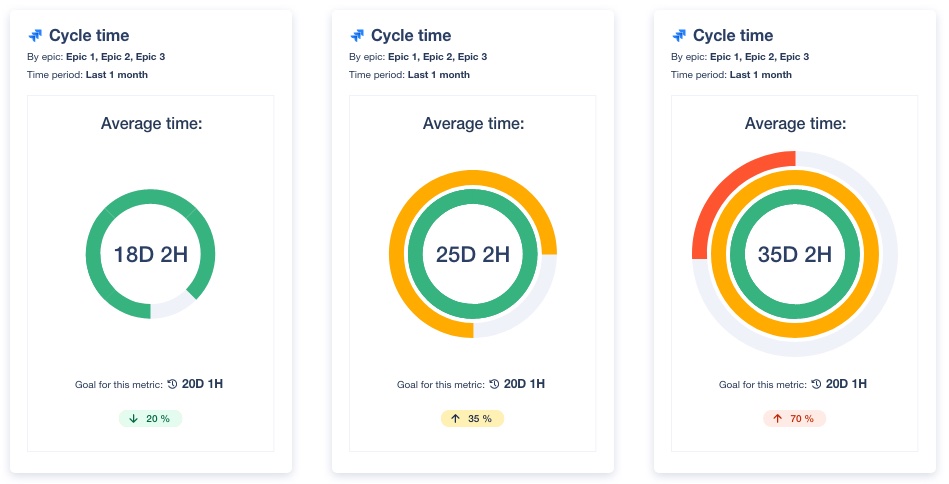
🟢 Green ring 🟢 : The first ring indicates if the cycle time is within the range 0% to 100% of your goal.
🟡 Yellow circle 🟡 : The second ring indicates if the cycle time is within the range 100% to 150% of your goal.
🔴 Red circle 🔴 : The third ring indicates if the cycle time is within the range 150% to 200% (or higher) of your goal.
List individual elements
You can select this option to list the different elements individually to display their times. In the following example, we are displaying all the projects in the bottom part of the gadget:

| Note |
|---|
If you choose Filters/Custom JQL you won’t be able to display the elements individually to avoid really large lists that hinder performance. |
Configuration
Name your gadget meaningfully, so everyone knows at a glance what it is about and when to use it. Fill out the rest of the fields as applicable, namely:
The datasource, where the source Jira instance is installed.
The Reporting by, select what element of work do you want to measure the cycle time: Assignees, Projects, Epics or Filters/Custom JQL
The Statuses, to measure the cycle time:
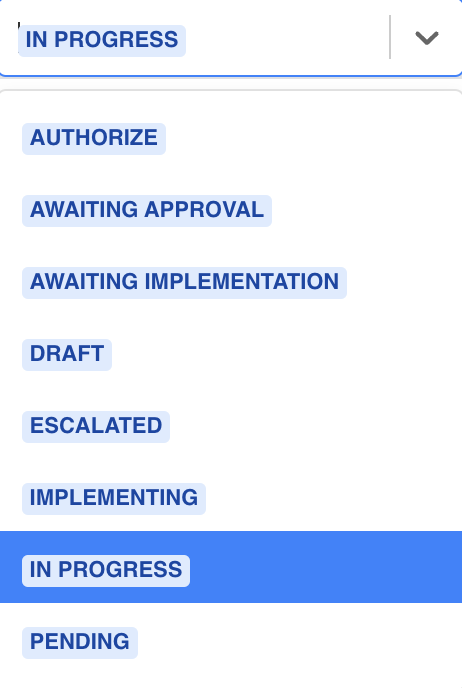
Status when the work starts on the issue. Any status where the Status Category is In Progress.
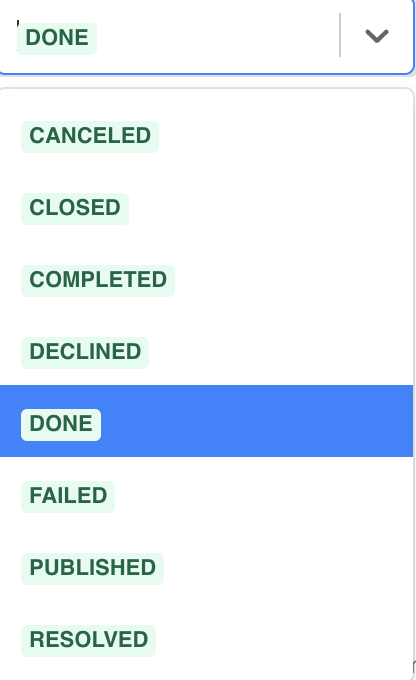
Status when the issue was delivered. Any status where the Status Category is Done.
The Goal for this metric, he time to beat to reach that goal.
The Time is calculated by means of, this is the calculation:
Average. The arithmetic mean, it sums the values of the grouped items and divides the result by the total number of items.
Median. It returns "the middle" value of the range of items of the group/field. If the number of items is even, then, the mean of the two values in the middle is returned.
The List all the individual report elements, to display in the gadget all the times of the items individually.
Finally, indicate if you want to use the current settings for all the compatible gadgets in the dashboard. This option eases the pain of configuring one by one the rest of the gadgets with the same default configuration
FAQ
| Expand | ||
|---|---|---|
| ||
The "Goal" field in the Lead Time and Cycle Time gadgets allows users to set a target for their time data, which can then be displayed on a graph along with the actual time data. This field is useful because it provides a visual representation of how well the team is meeting their time target and can help them identify when they are falling behind. Without a defined target, the data presented in the gadget may not provide much actionable insight. For example, if the graph simply shows the average lead time for work items over time, it may be difficult for the team to determine whether that time is reasonable or not. Additionally, without a target, the team may not have a clear goal to work towards or a way to measure their progress. This can make it more difficult for the team to identify areas for improvement in their delivery process and make meaningful changes. By setting a time target, the team has a clear goal to work towards and can more easily track their progress toward that goal. This can help them identify areas for improvement and continuously optimize their delivery process. |
| Expand | ||
|---|---|---|
| ||
The ring graph that we are using in these gadgets allows us to visualize the degree of compliance with the objectives set. The inner ring is responsible for showing the percentage of time that meets the set target, going from 0 to 100% and using the color green. When the time data exceeds the target time, the next ring, the yellow one, starts to fill in. This shows a moderate time excess, indicating that the time data exceeds the target time by up to 50%, i.e. it starts to fill when the time data is more than 100% of the target time and up to 150%. From time data exceeding 150% of the target time, a more serious time overrun is considered, starting to fill the outermost ring, the red one. This will be filled with the next 50% excess, i.e., it will start to fill when the time data exceeds 150% of the target time and will be completely filled when 200% is reached or exceeded. Some examples:
|
| Expand | ||
|---|---|---|
| ||
No, the only restriction to selecting the initial and final states is that they belong to the corresponding status category and belong to the selected datasource. That is, in the case of the Lead Time gadget, any state belonging to the "To Do" status category can be selected as the initial state. In the Cycle Time gadget, you can select as initial state any one that belongs to the status category "In Progress". And in both gadgets, you can select as the end state any one that belongs to the status category "Done". |
| Expand | ||
|---|---|---|
| ||
Depending on the different workflows, an issue may go through the same state several times, but we understand that the time period starts counting the first time it enters the initial state and ends the last time it enters the final state. For example, in a Cycle Time gadget with the initial status "In Progress" and the final status "Done" and with the following history of status changes in an issue:
The cycle time starts counting at point 2 and ends at point 8. |
| Expand | ||
|---|---|---|
| ||
In the case of calculating the time by the average, we consider that the time for that issue is zero since the count period has not started. In the case of time calculation using the median, these issues are not taken into account to avoid a high deviation of the result. |
Integrations
| Expand | ||||||||
|---|---|---|---|---|---|---|---|---|
| ||||||||
|
| Expand | ||||||||
|---|---|---|---|---|---|---|---|---|
| ||||||||
|
We are working on our growing catalog of Dashboard Gadgets: KPIs and Metrics and Dashboard Integrations: Supported Products, but contact us you want us to expedite a specific one, visit our Help Center.
Dashboards
This gadget is not included in any pre-defined dashboard, check other orphan gadgets:
| Expand | ||||||||
|---|---|---|---|---|---|---|---|---|
| ||||||||
|
See also
| Filter by label (Content by label) | ||||||
|---|---|---|---|---|---|---|
|