| Panel | ||||||||
|---|---|---|---|---|---|---|---|---|
| ||||||||
This page is about Canned Responses Pro Templates for Jira Cloud. Using Server or Data Center? Click here. |
The Insights page, which offers a compilation of data for all templates with advanced filtering functionality, provides managers with detailed statistics about how their team uses Canned Responses. Here you can view a list of templates with their usage statistics, as well as detailed Usage and History data for each template.
This way, managers can:
See which templates are used most often to know what works best, and see the least used, potentially abandoned templates to declutter
Analyze in which issues particular templates were used to see the full context of the communication
Promote the most popular Personal templates to Project and Global levels
Analyze detailed history log for templates to audit the changes and usage
To access the page, go to your project menu in Jira Cloud and click Canned Responses > Insights.

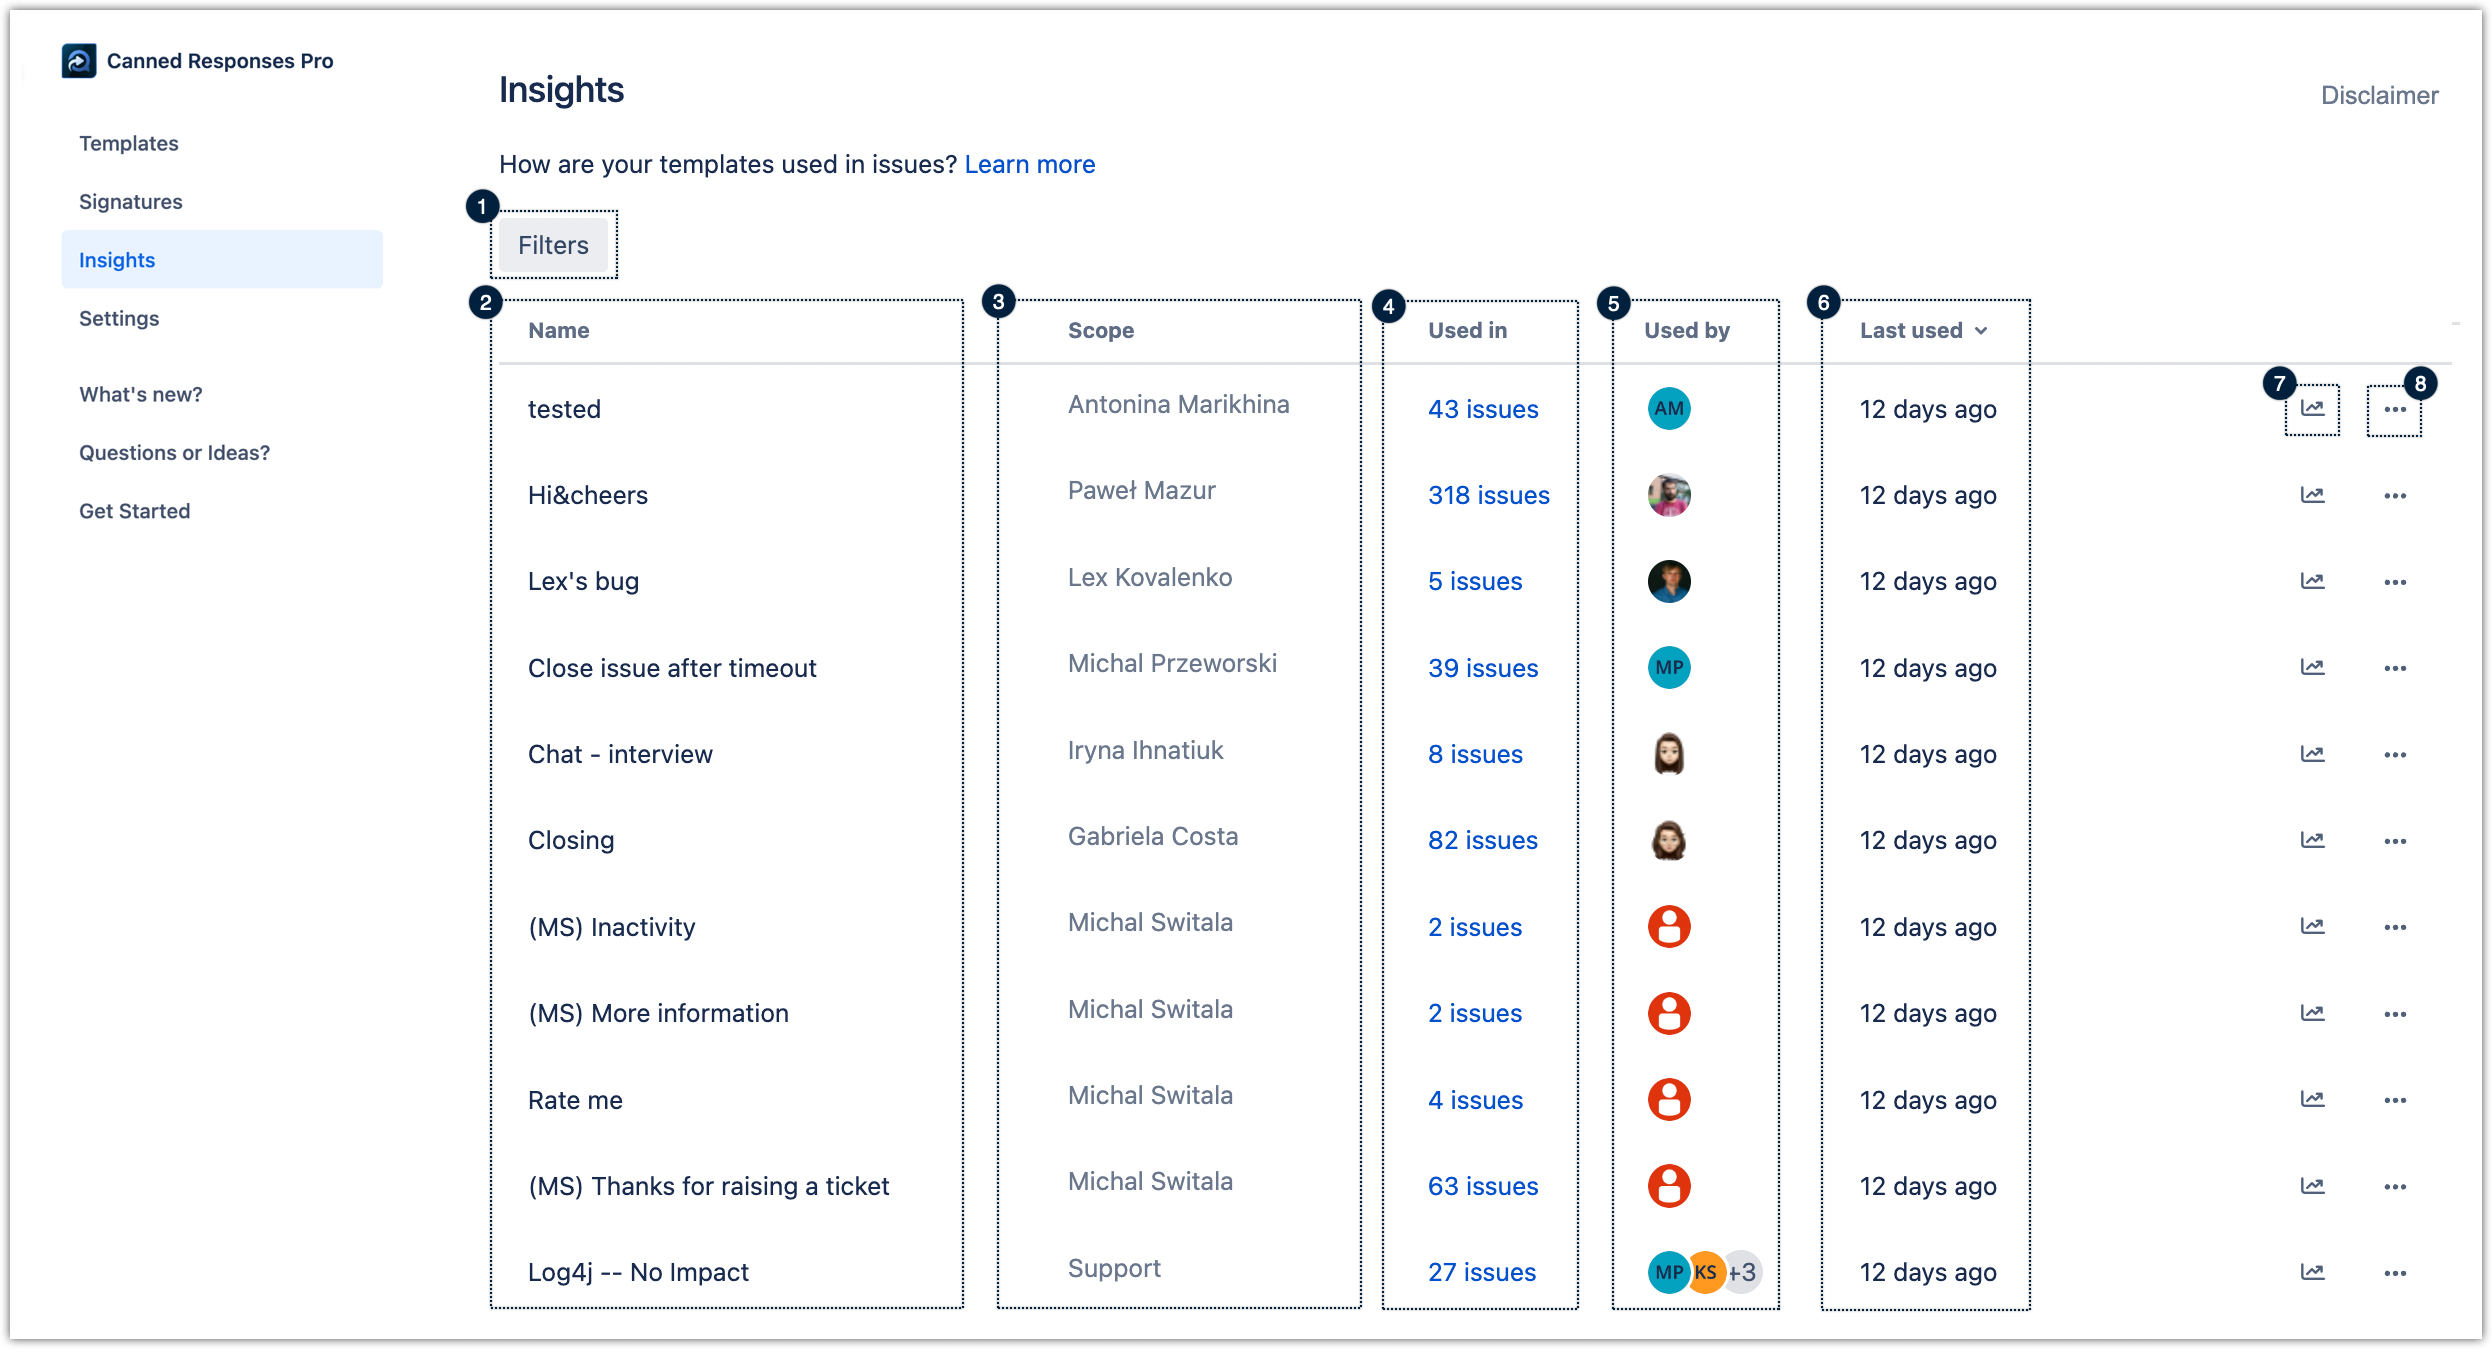
The Insights page contains several sections, each displaying specific information about template usage and statistics for each template. The templates can be reordered by clicking each section (e.g., by clicking “Used in”, you can see the least or most used templates first).
Let’s take a closer look at each section:
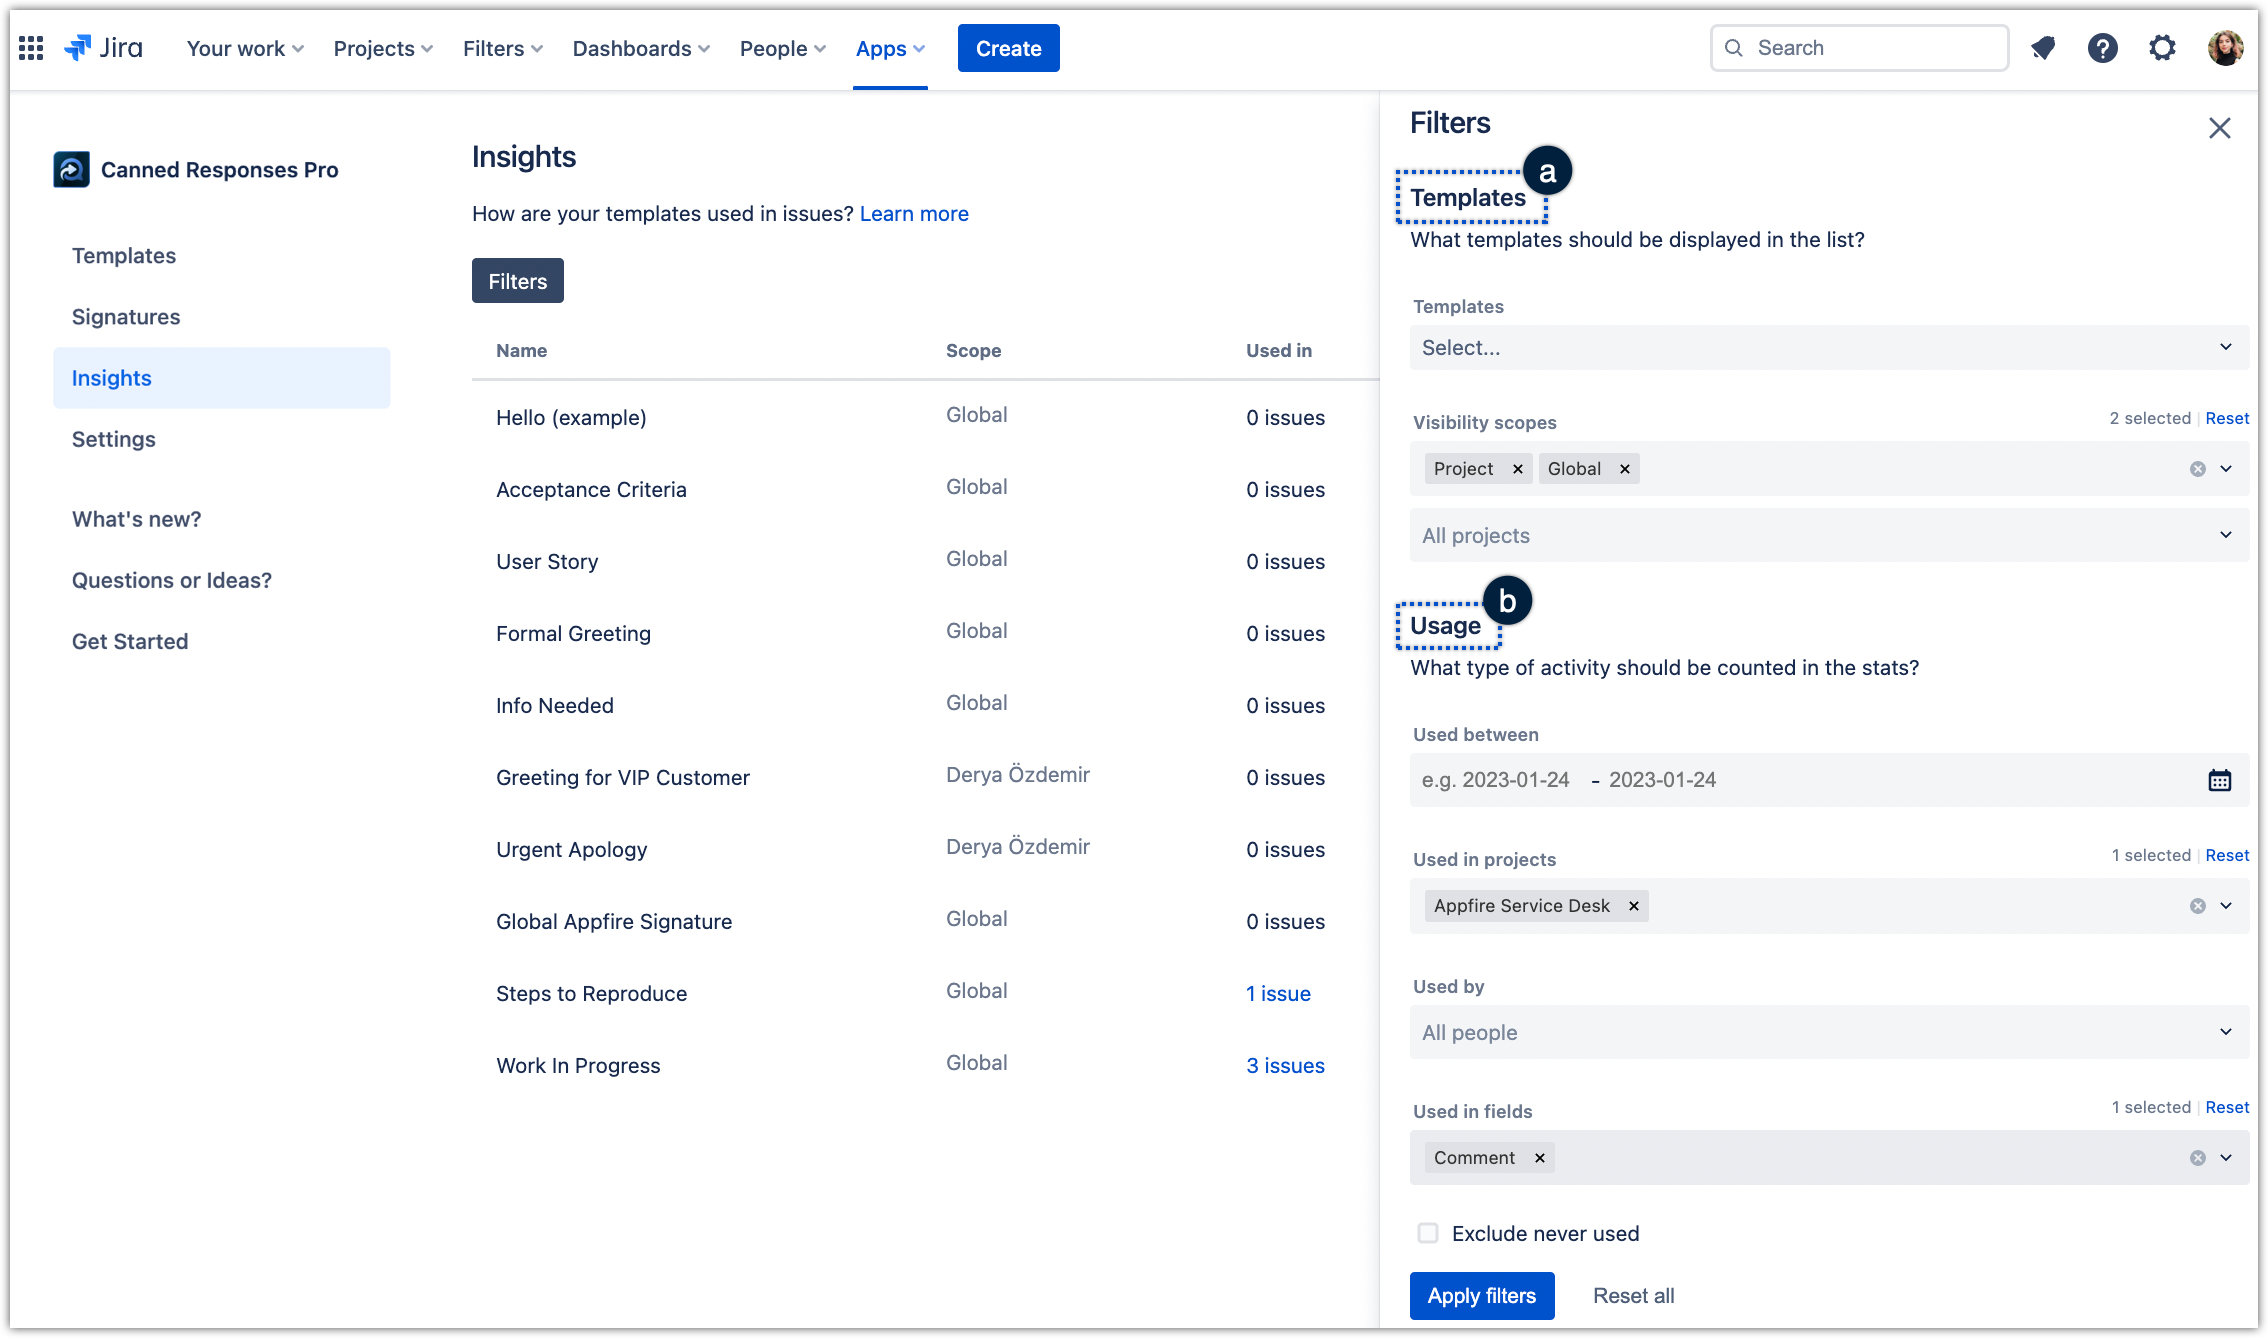
1. Filters – Use filters to refine what you see in the table. The filters page is divided into two sections: a) Templates filters, which refine which templates are displayed on the list, and b) Usage filters, which define what type of usage is counted in the statistics.
| Anchor | ||||
|---|---|---|---|---|
|

2. Name – The template’s name.
| Anchor | ||||
|---|---|---|---|---|
|
3. Scope – The visibility scope of the template, which was defined while creating it.
| Anchor | ||||
|---|---|---|---|---|
|
4. Used in – The number of issues the template was used in. Clicking on the issue number will let you view the list of issues.
| Anchor | ||||
|---|---|---|---|---|
|
5. Used by – The number of people the template has been used by.
| Anchor | ||||
|---|---|---|---|---|
|
6. Last used – The date on which the template was last used.
| Anchor | ||||
|---|---|---|---|---|
|
The templates might be highlighted in different colors based on the “Last used” date – yellow after 180 days and red after 360 days.
7. “Insights” button – To see a template’s statistics, click the Insights button next to the template you want to examine on the list of templates or in the edit dialog. Here you can analyze:
| Anchor | ||||
|---|---|---|---|---|
|
Usage over time, which shows the number of issues the template was used in.
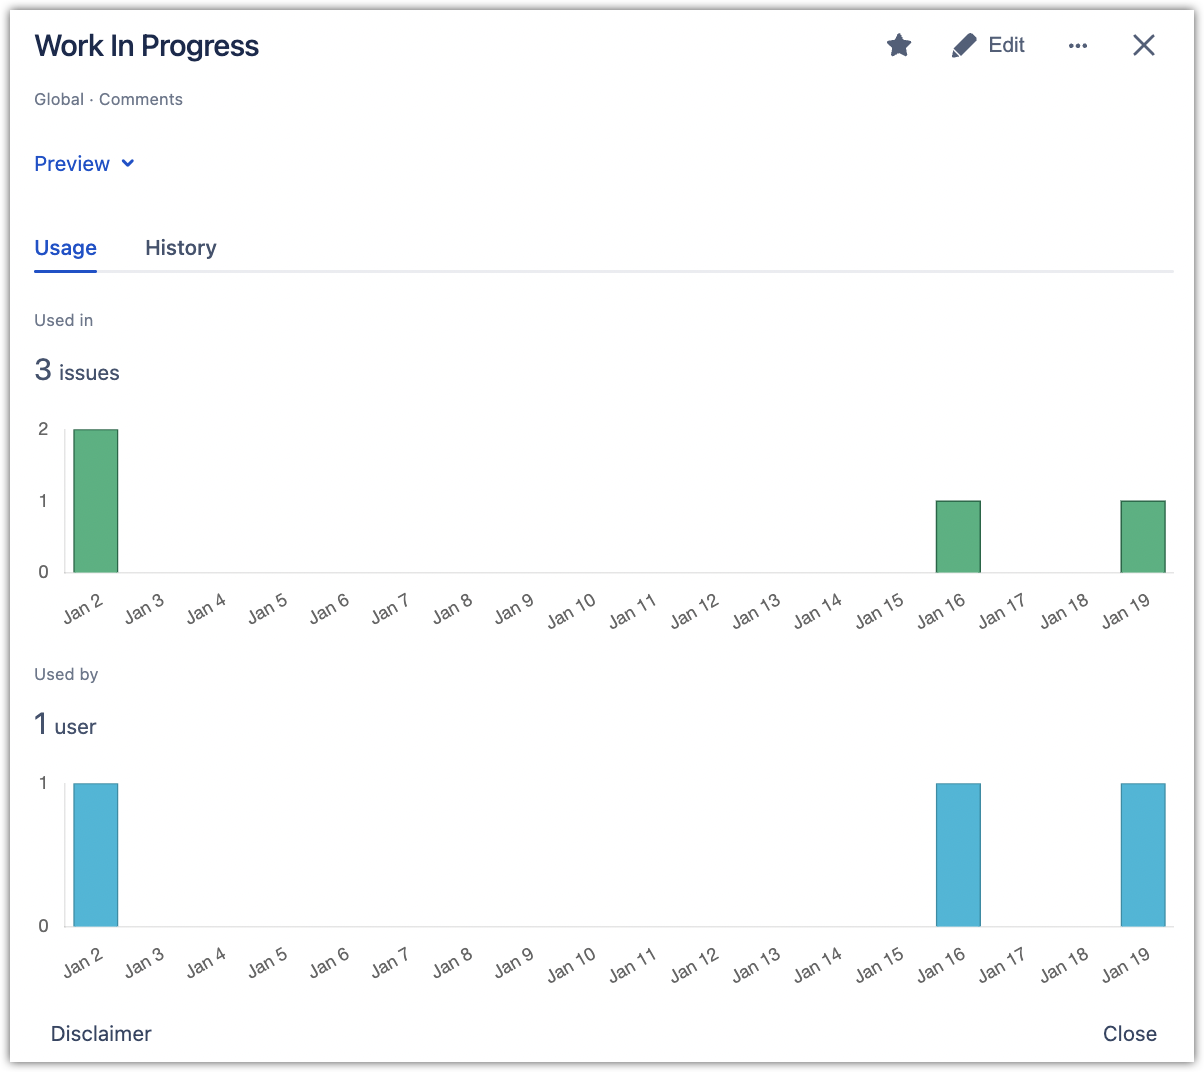
History of the template, such as when and by whom it was created, edited, and used in issues.
Anchor history history
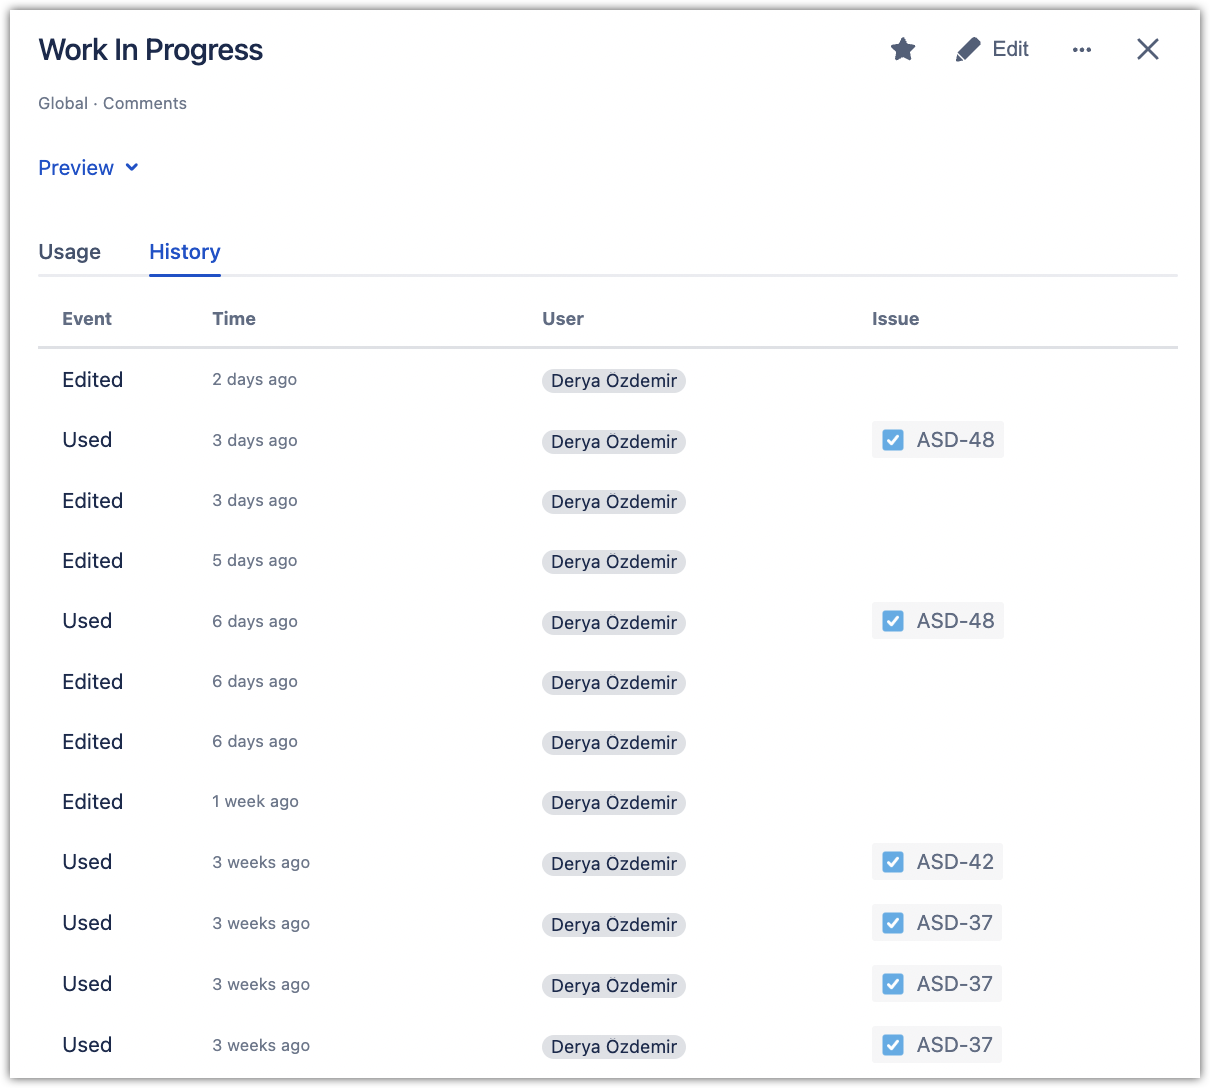
You can also access this information on your Jira project menu’s Canned Responses > Templates screen by clicking View Statistics next to the template you want to examine.
8. ![]() button – Here you can find options to duplicate a template, edit it, or remove it (which cannot be undone).
button – Here you can find options to duplicate a template, edit it, or remove it (which cannot be undone).
| Anchor | ||||
|---|---|---|---|---|
|
| Note |
|---|
Please keep in mind that, for all sections, usage data prior to August 12, 2021, is unavailable. |
| Panel | ||||||||
|---|---|---|---|---|---|---|---|---|
| ||||||||
We're looking for ideas! Would you like to see more statistics and insights about your templates? More granulated data? Dedicated reports? Please let us know! Your ideas, feedback, and suggestions will be much appreciated! |