You can We will use the following examples:
| Table of Contents |
|---|
...
example to show how you can measure Java garbage collection with Prometheus.
GarbageCollector statistics is one of the of metrics that the Java/JVM client library exposes.
If you invoke DefaultExports.initialize(); the Java client will expose a number of out of the box JVM metrics:
- memory Memory pools
- memory Memory allocations
- buffer Buffer pools
- threadsThreads
- JVM version
- loaded Loaded classes
- garbage Garbage collection
The GarbageCollector statistics comes from GarbageCollectorMXBean, and is exposed as the jvm_gc_collection_seconds summary.
In particular, jvm_gc_collection_seconds_count is responsible for the number of GCs, and jvm_gc_collection_seconds_sum deals with for how long they were taken.
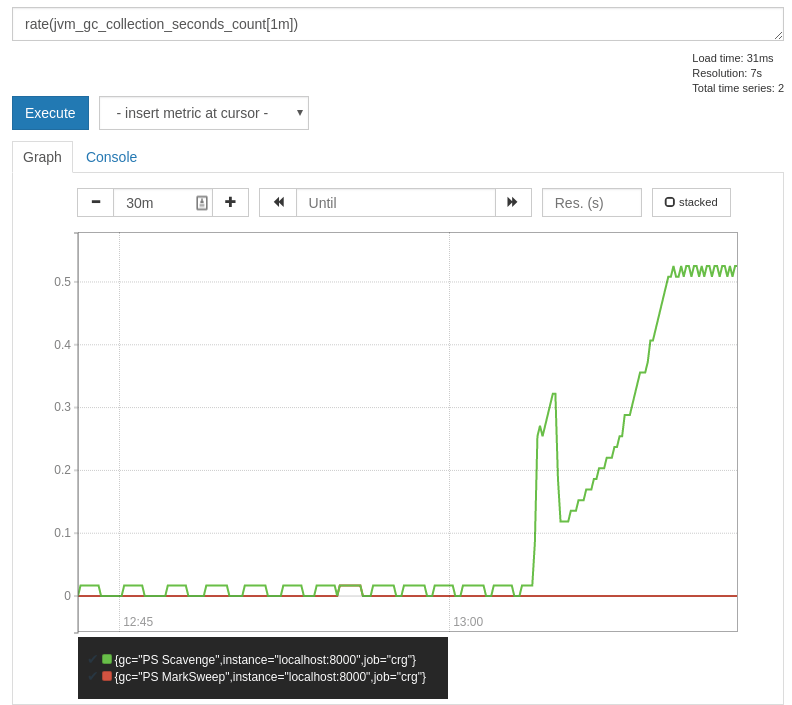
These are the counters, so we can take a rate:
We can see that PS Scavenge is happening once every 2 seconds or so, and PS MarkSweek is rare. You can have a question might ask which of those are the young generation and which the old/tenured, but this is not something the JVM exposes so you have to know this in your setup given the name.
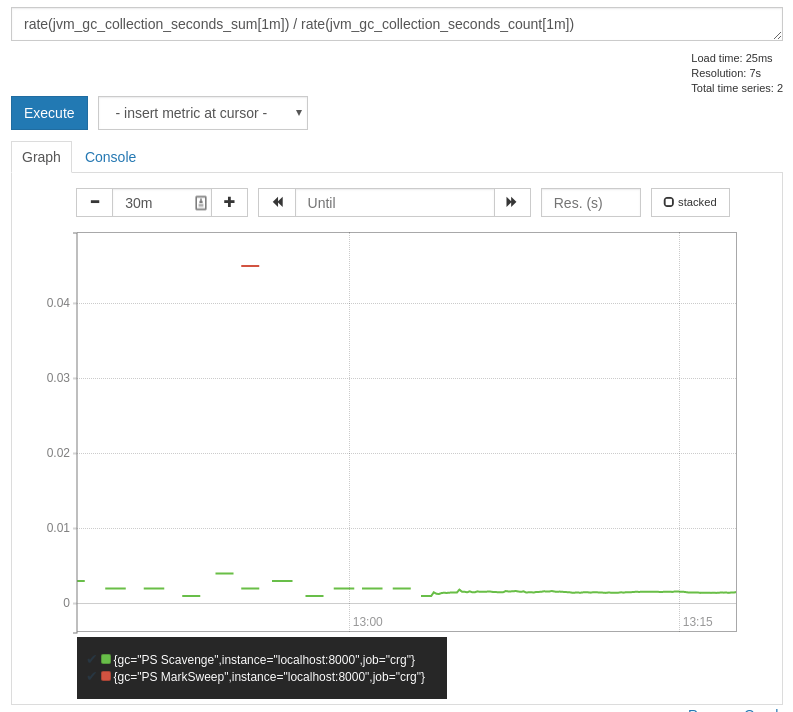
A GC every 2 seconds sounds excessive, and you can check how long it takes:
They are only taking about 1.5ms on average, which is acceptable. The single PS MarkSweek takes 45ms, but they are rare.
Finally, using rate(jvm_gc_collection_seconds_sum[1m]) you can see what proportion of time each type of GC is taking up, which per the previous numbers is under 0.1% so which is not a concern at all.
See also
_Prometheus Exporters - Configuring Prometheus Exporters


