After plug-in is successfully installed the following link can be used to expose metrics: /plugins/servlet/prometheus/metrics
Metrics:
ExamplesPrometheus Exporter for Confluence enables to expose Confluence metrics: JVM and application statistics to Prometheus.
The app exposes the following metrics:
- JVM
- Application statistics
- Login/logout statistics
- ...
- ...
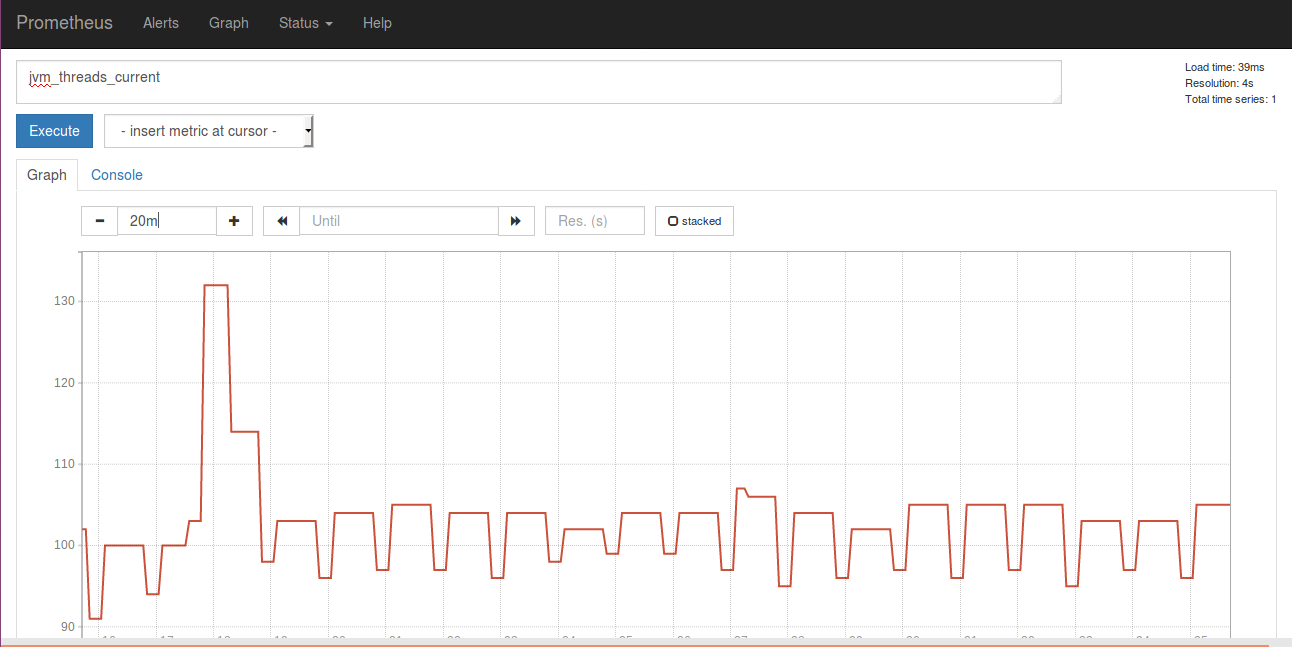
See the following examples for JVM Threads, Memory Usage and Login Count statistics:
- JVM Threads
- Memory
- Login Count


